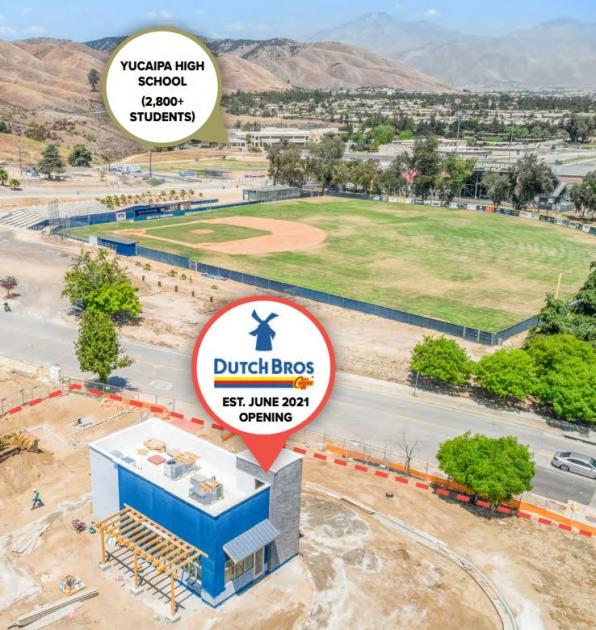
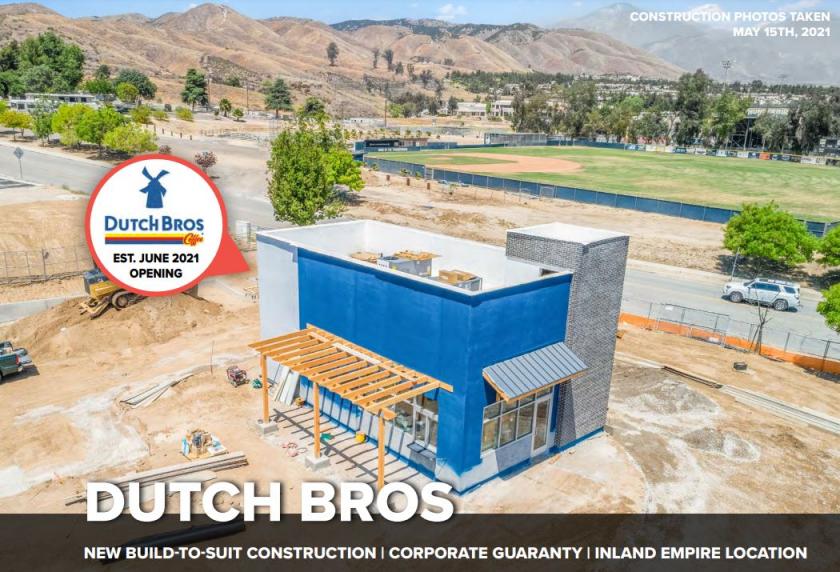
1-Mile | 3-Miles | 5-Miles | ||
---|---|---|---|---|
Total Population | 5,844 | 38,803 | 104,772 | |
Population Median Age | 36 | 36 | 38 | |
Population by Age | 0-9 Yrs | 831 (14%) | 5767 (14%) | 13715 (13%) |
10-19 Yrs | 799 (13%) | 5266 (13%) | 14576 (13%) | |
20-29 Yrs | 900 (15%) | 5872 (15%) | 15204 (14%) | |
30-39 Yrs | 838 (14%) | 4780 (12%) | 12908 (12%) | |
40-49 Yrs | 837 (14%) | 5311 (13%) | 13546 (12%) | |
50-59 Yrs | 663 (11%) | 4418 (11%) | 12390 (11%) | |
60-69 Yrs | 551 (9%) | 4085 (10%) | 12254 (11%) | |
70+ Yrs | 426 (7%) | 3304 (8%) | 10178 (9%) | |
Median HH Income | $80,571 | $69,664 | $74,177 | |
Total Household Income | < 24K | 306 (15%) | 2263 (17%) | 5551 (15%) |
25-49K | 340 (17%) | 2546 (19%) | 6292 (17%) | |
50-74K | 254 (13%) | 2194 (16%) | 6020 (17%) | |
75-99K | 327 (16%) | 1808 (13%) | 4666 (13%) | |
100-199K | 617 (31%) | 3487 (26%) | 9798 (27%) | |
200K+ | 101 (5%) | 752 (5%) | 2994 (8%) | |
Highest Education Level | No Diploma | 362 | 2822 | 6685 |
Diploma or GED | 941 | 6250 | 16445 | |
Some College | 1109 | 5900 | 16360 | |
Assoc. Degree | 385 | 3075 | 7940 | |
Bachelors Degree | 626 | 4005 | 12253 | |
Higher Degree | 380 | 2864 | 9213 | |
Total Housing Units | 1,982 | 13,936 | 37,514 | |
--Owner-Occupied | 1,313 | 8,996 | 25,581 | |
--Renter-Occupied | 632 | 4,054 | 9,741 | |
Owner-Occupied Values | < 100K | 29 | 1759 | 3788 |
100-199K | 92 | 480 | 1621 | |
200-299K | 294 | 1498 | 3776 | |
300-399K | 477 | 2535 | 7460 | |
400-499K | 205 | 1179 | 4042 | |
500K+ | 216 | 1545 | 4893 | |
Total Working Age Population | 4,550 | 29,820 | 82,454 | |
In Work Force | 2,957 | 18,571 | 50,745 | |
Not In Work Force | 1,592 | 11,249 | 31,710 | |
Workforce Employed | 2,868 | 17,731 | 48,105 | |
Workforce Unemployed | 90 | 840 | 2,636 | |
Civlian Workforce | 2,957 | 18,571 | 50,741 | |
Military Workforce | 0 | 0 | 3 | |
Total Households | 1,945 | 13,049 | 35,322 | |
Family Households | 1,404 | 9,274 | 24,954 | |
Non-Family Households | 542 | 3,775 | 10,368 | |
Married Couple | 972 | 6,819 | 19,002 | |
Other Family | 431 | 2,455 | 5,951 | |
Married w/Child | 433 | 3,232 | 8,411 | |
Single Male w/Child | 71 | 417 | 895 | |
Single Female w/Child | 94 | 698 | 1,730 |
Population Change Last Two Decades - Plus Projection
2000 | % | 2010 | % | 2020 | % | 2030 | |
---|---|---|---|---|---|---|---|
California | 33,871,648 | +10 | 37,253,956 | +9 | 40,467,295 | +8 | 43,631,295 |
Riverside County | 1,545,387 | +42 | 2,189,641 | +14 | 2,493,116 | +14 | 2,843,493 |
San Bernardino County | 1,709,434 | +19 | 2,035,210 | +9 | 2,223,189 | +11 | 2,468,202 |
Total Working Age Population:
Total Households:
Total Working Age Population:
Total Households:
Total Working Age Population:
Total Households: