Industrial Properties
103 East Benge Road Fort Gibson, OK 74434
103 East Benge Road Fort Gibson, OK 74434
Details & Description
Property Highlights
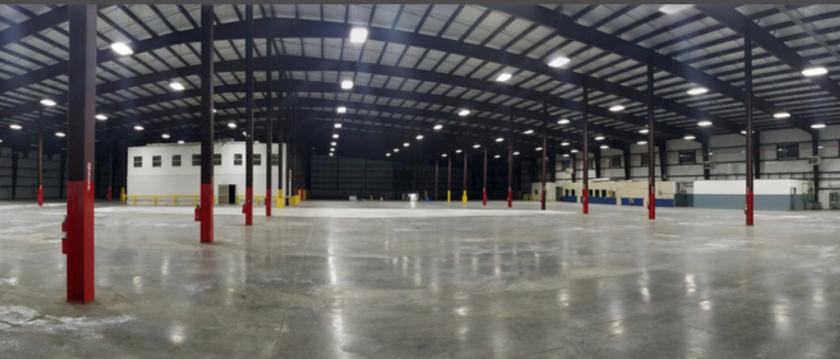
• Former use Pet Food container manufacturing
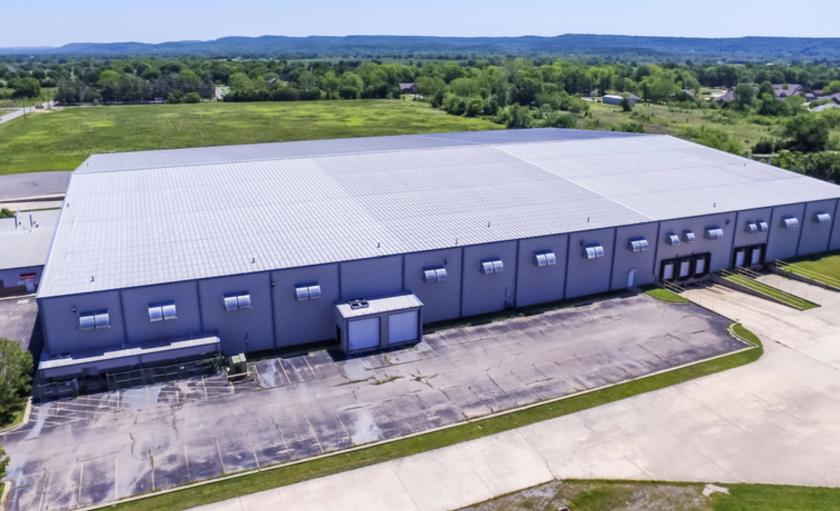
• 125 paved parking spaces
Listing Agents

Kipp Collins
O: 972-354-8078
kcollins@paladin-partners.com
O: 972-354-8078
kcollins@paladin-partners.com
While we strive to provide the most accurate information, all listing information, and demographic data, is provided by third-parties. As such, MyEListing will not be responsible for the accuracy of the information. It is strongly recommended that you verify all information with the listing agent, and any relevant agencies, prior to making any decisions.