Industrial Properties
100 West Airport Road Stillwater, OK 74075
100 West Airport Road Stillwater, OK 74075
Details & Description
Property Highlights
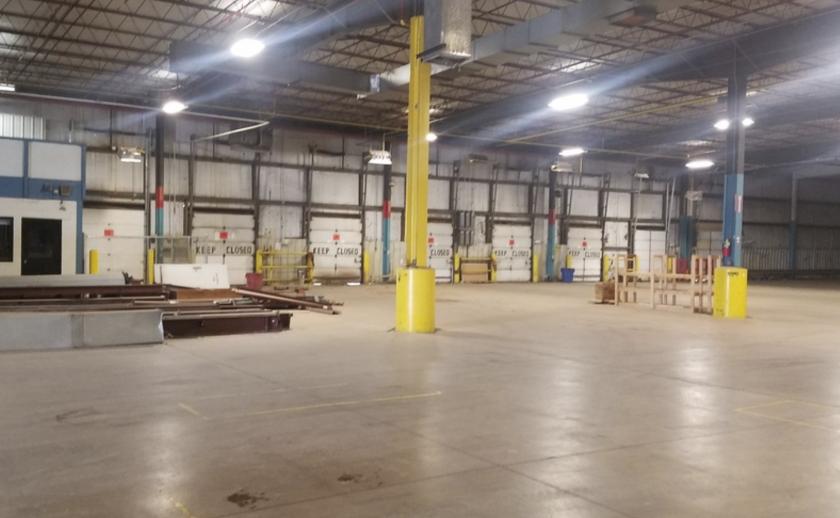
• The East section of the warehouse contains three crane bays in 71,400 sq. ft. each designed for up to 120-ton capacity
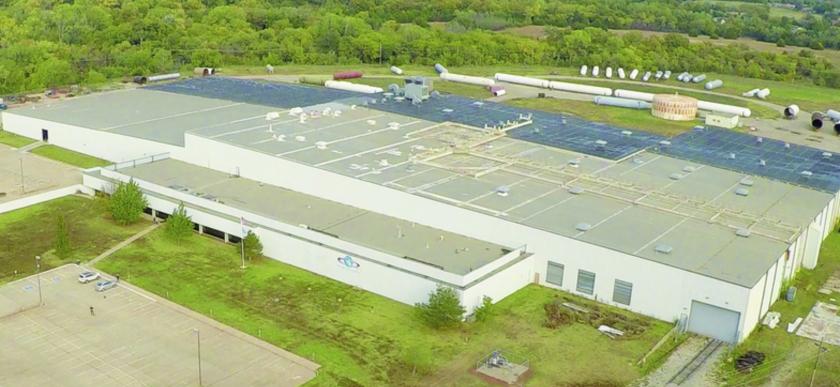
• The office facility includes a reception area, an open work area, a conference room and numerous private offices
Listing Agents

Kipp Collins
O: 972-354-8078
kcollins@paladin-partners.com
O: 972-354-8078
kcollins@paladin-partners.com
While we strive to provide the most accurate information, all listing information, and demographic data, is provided by third-parties. As such, MyEListing will not be responsible for the accuracy of the information. It is strongly recommended that you verify all information with the listing agent, and any relevant agencies, prior to making any decisions.