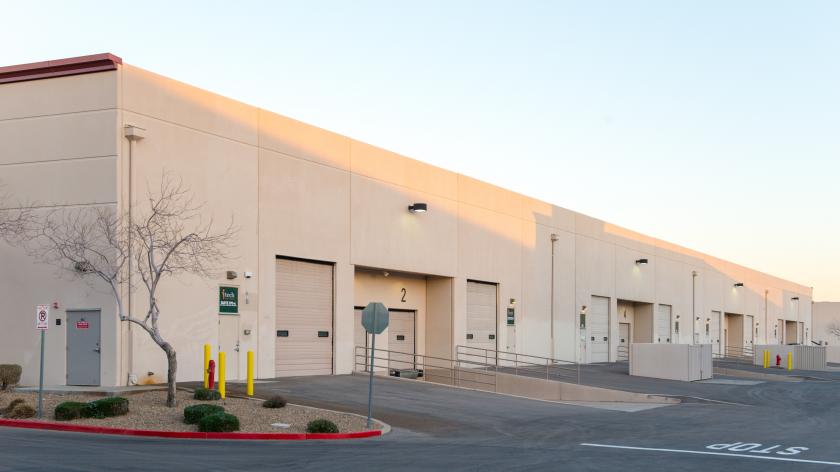
1-Mile | 3-Miles | 5-Miles | ||
---|---|---|---|---|
Total Population | 4,379 | 102,502 | 258,434 | |
Population Median Age | 37 | 39 | 39 | |
Population by Age | 0-9 Yrs | 506 (11%) | 11008 (10%) | 29523 (11%) |
10-19 Yrs | 594 (13%) | 13063 (12%) | 32685 (12%) | |
20-29 Yrs | 560 (12%) | 14824 (14%) | 32724 (12%) | |
30-39 Yrs | 733 (16%) | 15907 (15%) | 36834 (14%) | |
40-49 Yrs | 760 (17%) | 14013 (13%) | 35305 (13%) | |
50-59 Yrs | 505 (11%) | 13271 (12%) | 35097 (13%) | |
60-69 Yrs | 461 (10%) | 11005 (10%) | 29426 (11%) | |
70+ Yrs | 260 (5%) | 9411 (9%) | 26841 (10%) | |
Median HH Income | $66,193 | $63,823 | $65,309 | |
Total Household Income | < 24K | 223 (14%) | 6369 (16%) | 15499 (16%) |
25-49K | 339 (21%) | 8252 (21%) | 20571 (21%) | |
50-74K | 316 (19%) | 8154 (21%) | 18767 (19%) | |
75-99K | 169 (10%) | 5571 (14%) | 13656 (14%) | |
100-199K | 440 (27%) | 8378 (21%) | 21630 (22%) | |
200K+ | 98 (6%) | 1769 (4%) | 5853 (6%) | |
Highest Education Level | No Diploma | 380 | 6579 | 17453 |
Diploma or GED | 919 | 21298 | 52557 | |
Some College | 797 | 18943 | 47131 | |
Assoc. Degree | 180 | 6200 | 15339 | |
Bachelors Degree | 583 | 13058 | 31643 | |
Higher Degree | 227 | 6242 | 18199 | |
Total Housing Units | 1,768 | 43,194 | 107,414 | |
--Owner-Occupied | 756 | 20,391 | 55,803 | |
--Renter-Occupied | 830 | 18,103 | 40,172 | |
Owner-Occupied Values | < 100K | 41 | 1821 | 3778 |
100-199K | 121 | 4625 | 11863 | |
200-299K | 349 | 6973 | 18975 | |
300-399K | 190 | 4369 | 11791 | |
400-499K | 54 | 1837 | 5509 | |
500K+ | 1 | 766 | 3888 | |
Total Working Age Population | 3,467 | 83,424 | 208,785 | |
In Work Force | 2,398 | 56,105 | 135,635 | |
Not In Work Force | 1,070 | 27,319 | 73,151 | |
Workforce Employed | 2,264 | 52,264 | 126,302 | |
Workforce Unemployed | 127 | 3,678 | 8,992 | |
Civlian Workforce | 2,392 | 55,942 | 135,295 | |
Military Workforce | 6 | 163 | 340 | |
Total Households | 1,586 | 38,493 | 95,976 | |
Family Households | 1,032 | 24,375 | 61,489 | |
Non-Family Households | 554 | 14,119 | 34,487 | |
Married Couple | 685 | 16,561 | 43,359 | |
Other Family | 347 | 7,814 | 18,130 | |
Married w/Child | 283 | 6,565 | 16,327 | |
Single Male w/Child | 111 | 1,035 | 2,493 | |
Single Female w/Child | 84 | 2,489 | 5,926 |
Population Change Last Two Decades - Plus Projection
2000 | % | 2010 | % | 2020 | % | 2030 | |
---|---|---|---|---|---|---|---|
Nevada | 1,998,257 | +35 | 2,700,551 | +17 | 3,149,234 | +10 | 3,460,728 |
Clark County | 1,375,765 | +42 | 1,951,269 | +19 | 2,318,174 | +10 | 2,550,048 |
Nye County | 32,485 | +35 | 43,946 | +11 | 48,864 | +8 | 52,587 |
Total Working Age Population:
Total Households:
Total Working Age Population:
Total Households:
Total Working Age Population:
Total Households: