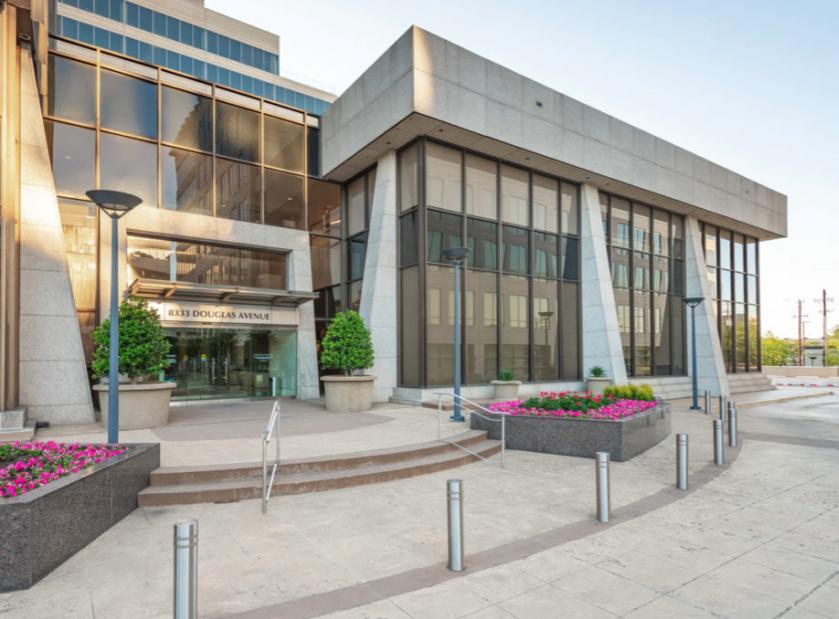
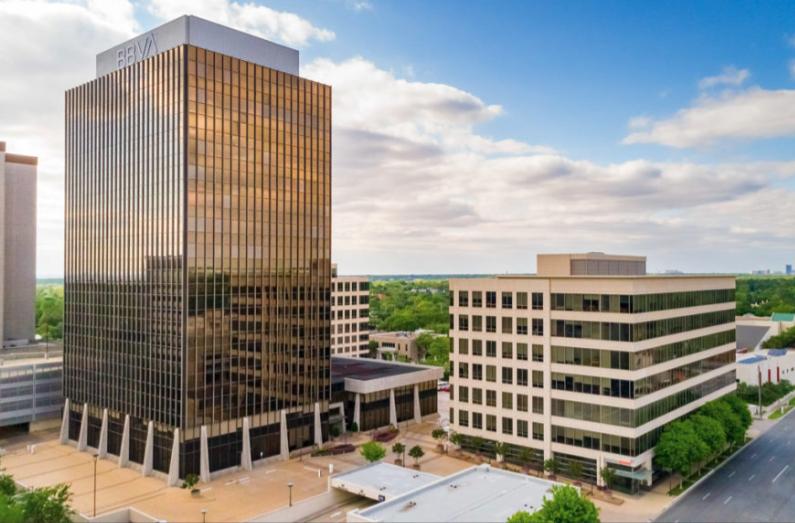
1-Mile | 3-Miles | 5-Miles | ||
---|---|---|---|---|
Total Population | 11,279 | 120,954 | 385,265 | |
Population Median Age | 41 | 39 | 37 | |
Population by Age | 0-9 Yrs | 1587 (14%) | 12752 (10%) | 43285 (11%) |
10-19 Yrs | 1638 (14%) | 13592 (11%) | 38591 (10%) | |
20-29 Yrs | 442 (3%) | 19629 (16%) | 74879 (19%) | |
30-39 Yrs | 1178 (10%) | 16613 (13%) | 66588 (17%) | |
40-49 Yrs | 1752 (15%) | 15826 (13%) | 49465 (12%) | |
50-59 Yrs | 1843 (16%) | 16541 (13%) | 45824 (11%) | |
60-69 Yrs | 1487 (13%) | 13439 (11%) | 35325 (9%) | |
70+ Yrs | 1352 (11%) | 12562 (10%) | 31308 (8%) | |
Median HH Income | $168,760 | $89,445 | $74,477 | |
Total Household Income | < 24K | 281 (6%) | 7100 (13%) | 25819 (14%) |
25-49K | 509 (11%) | 9031 (16%) | 32890 (19%) | |
50-74K | 441 (9%) | 7942 (14%) | 28162 (16%) | |
75-99K | 302 (6%) | 5481 (10%) | 18378 (10%) | |
100-199K | 903 (20%) | 10320 (18%) | 36050 (20%) | |
200K+ | 2058 (45%) | 14607 (26%) | 31388 (18%) | |
Highest Education Level | No Diploma | 114 | 5422 | 37355 |
Diploma or GED | 241 | 7449 | 32746 | |
Some College | 787 | 10860 | 38533 | |
Assoc. Degree | 182 | 2587 | 10466 | |
Bachelors Degree | 3539 | 34084 | 91838 | |
Higher Degree | 2988 | 25462 | 63151 | |
Total Housing Units | 5,061 | 62,056 | 195,996 | |
--Owner-Occupied | 3,720 | 28,633 | 71,750 | |
--Renter-Occupied | 774 | 25,849 | 100,938 | |
Owner-Occupied Values | < 100K | 52 | 1055 | 3767 |
100-199K | 199 | 2794 | 9367 | |
200-299K | 270 | 2368 | 8141 | |
300-399K | 197 | 1686 | 8695 | |
400-499K | 84 | 1647 | 8093 | |
500K+ | 2919 | 19082 | 33686 | |
Total Working Age Population | 8,656 | 100,153 | 318,039 | |
In Work Force | 5,173 | 68,144 | 230,926 | |
Not In Work Force | 3,483 | 32,010 | 87,114 | |
Workforce Employed | 5,025 | 66,012 | 223,192 | |
Workforce Unemployed | 149 | 2,096 | 7,626 | |
Civlian Workforce | 5,173 | 68,107 | 230,818 | |
Military Workforce | 0 | 36 | 108 | |
Total Households | 4,494 | 54,481 | 172,688 | |
Family Households | 3,230 | 28,968 | 85,321 | |
Non-Family Households | 1,264 | 25,513 | 87,367 | |
Married Couple | 2,945 | 24,579 | 66,068 | |
Other Family | 286 | 4,389 | 19,253 | |
Married w/Child | 1,519 | 10,506 | 28,342 | |
Single Male w/Child | 58 | 652 | 2,362 | |
Single Female w/Child | 117 | 1,570 | 7,056 |
Population Change Last Two Decades - Plus Projection
2000 | % | 2010 | % | 2020 | % | 2030 | |
---|---|---|---|---|---|---|---|
Texas | 20,851,820 | +21 | 25,145,561 | +18 | 29,677,668 | +18 | 34,894,452 |
Dallas County | 2,218,899 | +7 | 2,368,139 | +15 | 2,734,111 | +14 | 3,106,298 |
Total Working Age Population:
Total Households:
Total Working Age Population:
Total Households:
Total Working Age Population:
Total Households: