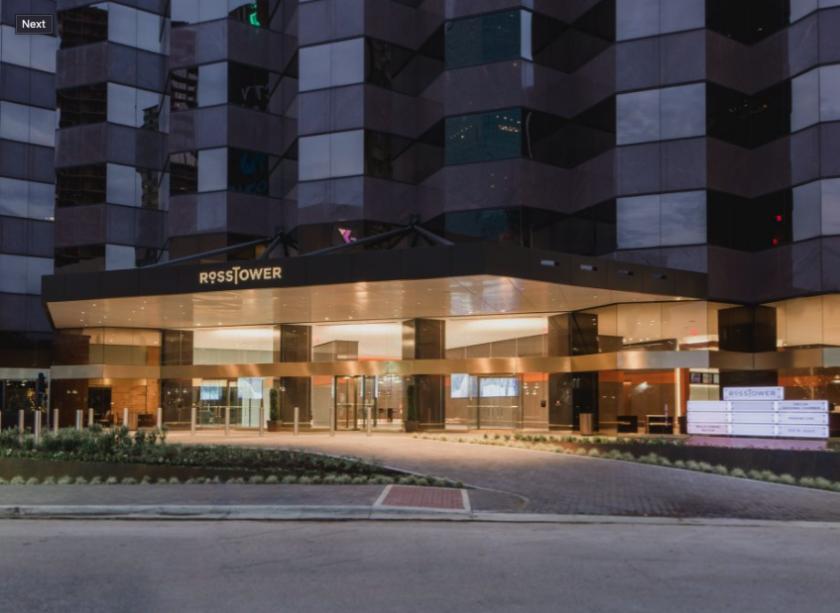
1-Mile | 3-Miles | 5-Miles | ||
---|---|---|---|---|
Total Population | 24,179 | 158,872 | 363,744 | |
Population Median Age | 36 | 36 | 36 | |
Population by Age | 0-9 Yrs | 759 (3%) | 13174 (8%) | 42529 (11%) |
10-19 Yrs | 571 (2%) | 10336 (6%) | 37971 (10%) | |
20-29 Yrs | 9106 (37%) | 42913 (27%) | 76324 (20%) | |
30-39 Yrs | 6516 (26%) | 34463 (21%) | 63713 (17%) | |
40-49 Yrs | 2629 (10%) | 19649 (12%) | 46726 (12%) | |
50-59 Yrs | 2465 (10%) | 18060 (11%) | 42915 (11%) | |
60-69 Yrs | 1389 (5%) | 12139 (7%) | 31334 (8%) | |
70+ Yrs | 744 (3%) | 8139 (5%) | 22233 (6%) | |
Median HH Income | $93,207 | $69,634 | $64,823 | |
Total Household Income | < 24K | 1606 (11%) | 13881 (17%) | 30956 (20%) |
25-49K | 1558 (10%) | 14040 (17%) | 29589 (19%) | |
50-74K | 2511 (17%) | 14387 (18%) | 26612 (17%) | |
75-99K | 2159 (14%) | 10167 (12%) | 17501 (11%) | |
100-199K | 4663 (32%) | 17956 (22%) | 30337 (19%) | |
200K+ | 1997 (13%) | 8483 (10%) | 19688 (12%) | |
Highest Education Level | No Diploma | 616 | 19084 | 49874 |
Diploma or GED | 1529 | 17190 | 43278 | |
Some College | 2472 | 17979 | 36460 | |
Assoc. Degree | 904 | 5287 | 9811 | |
Bachelors Degree | 8961 | 38091 | 69324 | |
Higher Degree | 5457 | 23397 | 45079 | |
Total Housing Units | 17,024 | 92,365 | 177,298 | |
--Owner-Occupied | 2,322 | 19,820 | 58,153 | |
--Renter-Occupied | 12,173 | 59,094 | 96,529 | |
Owner-Occupied Values | < 100K | 62 | 2833 | 11498 |
100-199K | 166 | 3897 | 10585 | |
200-299K | 495 | 2677 | 6547 | |
300-399K | 472 | 2972 | 6226 | |
400-499K | 272 | 2265 | 5037 | |
500K+ | 855 | 5175 | 18261 | |
Total Working Age Population | 23,124 | 139,424 | 297,909 | |
In Work Force | 19,266 | 103,690 | 208,215 | |
Not In Work Force | 3,858 | 35,734 | 89,693 | |
Workforce Employed | 18,643 | 99,406 | 198,272 | |
Workforce Unemployed | 623 | 4,247 | 9,852 | |
Civlian Workforce | 19,266 | 103,652 | 208,125 | |
Military Workforce | 0 | 38 | 91 | |
Total Households | 14,495 | 78,914 | 154,682 | |
Family Households | 3,478 | 27,525 | 72,187 | |
Non-Family Households | 11,017 | 51,389 | 82,495 | |
Married Couple | 2,725 | 18,512 | 48,501 | |
Other Family | 753 | 9,013 | 23,687 | |
Married w/Child | 310 | 4,894 | 19,040 | |
Single Male w/Child | 116 | 972 | 2,399 | |
Single Female w/Child | 338 | 3,631 | 9,072 |
Population Change Last Two Decades - Plus Projection
2000 | % | 2010 | % | 2020 | % | 2030 | |
---|---|---|---|---|---|---|---|
Texas | 20,851,820 | +21 | 25,145,561 | +18 | 29,677,668 | +18 | 34,894,452 |
Dallas County | 2,218,899 | +7 | 2,368,139 | +15 | 2,734,111 | +14 | 3,106,298 |
Total Working Age Population:
Total Households:
Total Working Age Population:
Total Households:
Total Working Age Population:
Total Households: