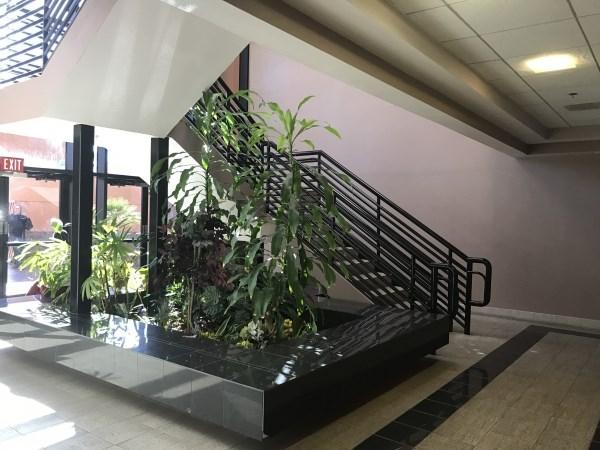
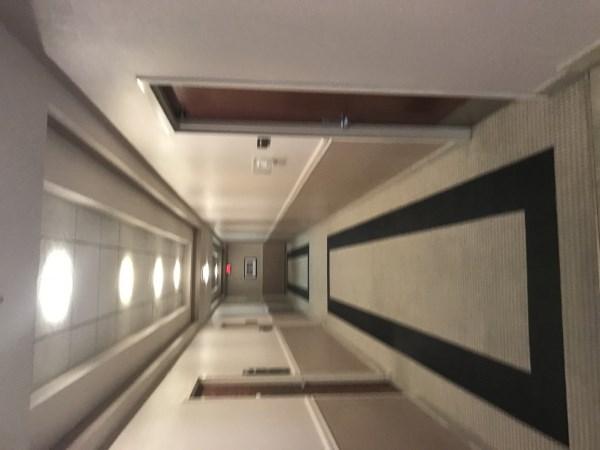
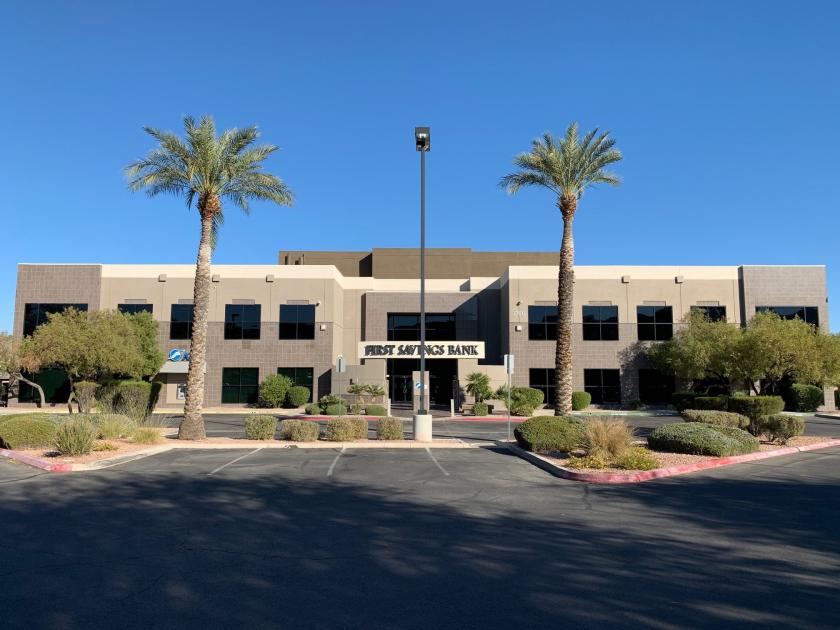
1-Mile | 3-Miles | 5-Miles | ||
---|---|---|---|---|
Total Population | 11,956 | 101,717 | 273,253 | |
Population Median Age | 44 | 41 | 40 | |
Population by Age | 0-9 Yrs | 1461 (12%) | 10346 (10%) | 28903 (10%) |
10-19 Yrs | 1376 (11%) | 12387 (12%) | 33228 (12%) | |
20-29 Yrs | 678 (5%) | 11621 (11%) | 34760 (12%) | |
30-39 Yrs | 1466 (12%) | 13697 (13%) | 37880 (13%) | |
40-49 Yrs | 1750 (14%) | 14662 (14%) | 37600 (13%) | |
50-59 Yrs | 1497 (12%) | 13854 (13%) | 36185 (13%) | |
60-69 Yrs | 1580 (13%) | 12192 (11%) | 32936 (12%) | |
70+ Yrs | 2149 (17%) | 12958 (12%) | 31762 (11%) | |
Median HH Income | $88,444 | $80,352 | $72,532 | |
Total Household Income | < 24K | 497 (10%) | 4555 (11%) | 13912 (13%) |
25-49K | 795 (16%) | 7255 (17%) | 21025 (19%) | |
50-74K | 740 (15%) | 7100 (17%) | 19775 (18%) | |
75-99K | 586 (12%) | 6051 (14%) | 15488 (14%) | |
100-199K | 1333 (28%) | 11182 (27%) | 26553 (25%) | |
200K+ | 743 (15%) | 4268 (10%) | 8841 (8%) | |
Highest Education Level | No Diploma | 460 | 3659 | 13028 |
Diploma or GED | 1701 | 16948 | 48721 | |
Some College | 1867 | 18571 | 51761 | |
Assoc. Degree | 676 | 6558 | 17658 | |
Bachelors Degree | 2234 | 17930 | 41450 | |
Higher Degree | 1859 | 10859 | 24381 | |
Total Housing Units | 5,175 | 45,119 | 117,084 | |
--Owner-Occupied | 3,610 | 24,446 | 61,719 | |
--Renter-Occupied | 1,084 | 15,966 | 43,876 | |
Owner-Occupied Values | < 100K | 60 | 748 | 2066 |
100-199K | 210 | 2285 | 7526 | |
200-299K | 988 | 7052 | 19351 | |
300-399K | 1045 | 7281 | 16377 | |
400-499K | 695 | 3982 | 8685 | |
500K+ | 612 | 3099 | 7715 | |
Total Working Age Population | 9,645 | 83,513 | 224,287 | |
In Work Force | 5,561 | 53,892 | 144,595 | |
Not In Work Force | 4,084 | 29,621 | 79,693 | |
Workforce Employed | 5,263 | 50,823 | 135,909 | |
Workforce Unemployed | 289 | 2,915 | 8,326 | |
Civlian Workforce | 5,552 | 53,738 | 144,234 | |
Military Workforce | 9 | 154 | 360 | |
Total Households | 4,693 | 40,413 | 105,595 | |
Family Households | 3,174 | 25,308 | 67,298 | |
Non-Family Households | 1,519 | 15,104 | 38,297 | |
Married Couple | 2,708 | 19,676 | 49,302 | |
Other Family | 466 | 5,632 | 17,996 | |
Married w/Child | 1,049 | 7,555 | 18,365 | |
Single Male w/Child | 71 | 1,164 | 2,875 | |
Single Female w/Child | 118 | 1,419 | 5,809 |
Population Change Last Two Decades - Plus Projection
2000 | % | 2010 | % | 2020 | % | 2030 | |
---|---|---|---|---|---|---|---|
Nevada | 1,998,257 | +35 | 2,700,551 | +17 | 3,149,234 | +10 | 3,460,728 |
Clark County | 1,375,765 | +42 | 1,951,269 | +19 | 2,318,174 | +10 | 2,550,048 |
Nye County | 32,485 | +35 | 43,946 | +11 | 48,864 | +8 | 52,587 |
Total Working Age Population:
Total Households:
Total Working Age Population:
Total Households:
Total Working Age Population:
Total Households: