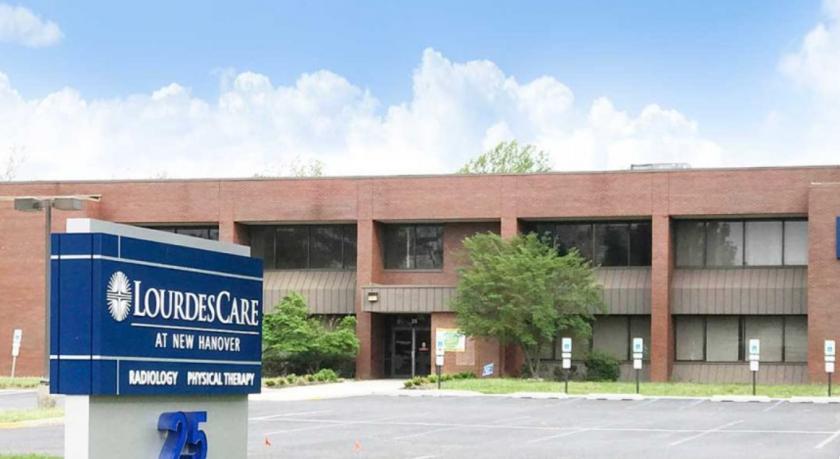
Office Space
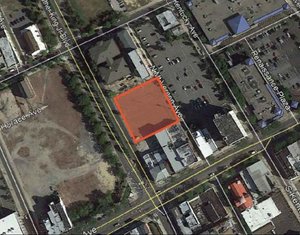
25 Wrightstown Cookstown Road Cookstown, NJ 08511
25 Wrightstown Cookstown Road Cookstown, NJ 08511
Details & Description
Property Highlights
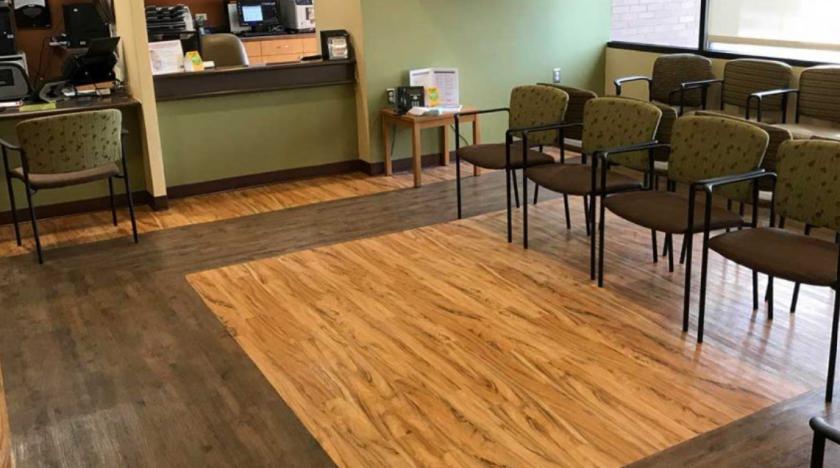
• Great office building. Located outside Joint Base McGuire-Dix-Lakehurst military installation
• Basement level already fitted out as gym complete with spinning area, showers and restrooms
Listing Agents

Corinne Giletto
O: 856-797-1919
corinne.giletto@vantageres.com
O: 856-797-1919
corinne.giletto@vantageres.com
While we strive to provide the most accurate information, all listing information, and demographic data, is provided by third-parties. As such, MyEListing will not be responsible for the accuracy of the information. It is strongly recommended that you verify all information with the listing agent, and any relevant agencies, prior to making any decisions.