Commercial Land
617 Atlantic Avenue Atlantic City, NJ 08401
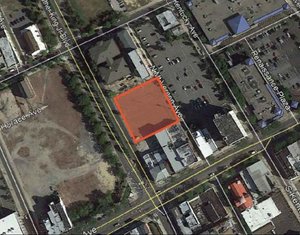
617 Atlantic Avenue Atlantic City, NJ 08401

Details & Description
Property Highlights
• Across from a major residential development, a block from the Ocean Club former Revel Casino and blocks from the inle
• Rare opportunity to purchase a corner lot in an area of Atlantic City which is undergoing massive redevelopment
Listing Agents

Corinne Giletto
O: 856-797-1919
corinne.giletto@vantageres.com
O: 856-797-1919
corinne.giletto@vantageres.com
While we strive to provide the most accurate information, all listing information, and demographic data, is provided by third-parties. As such, MyEListing will not be responsible for the accuracy of the information. It is strongly recommended that you verify all information with the listing agent, and any relevant agencies, prior to making any decisions.