Office Space
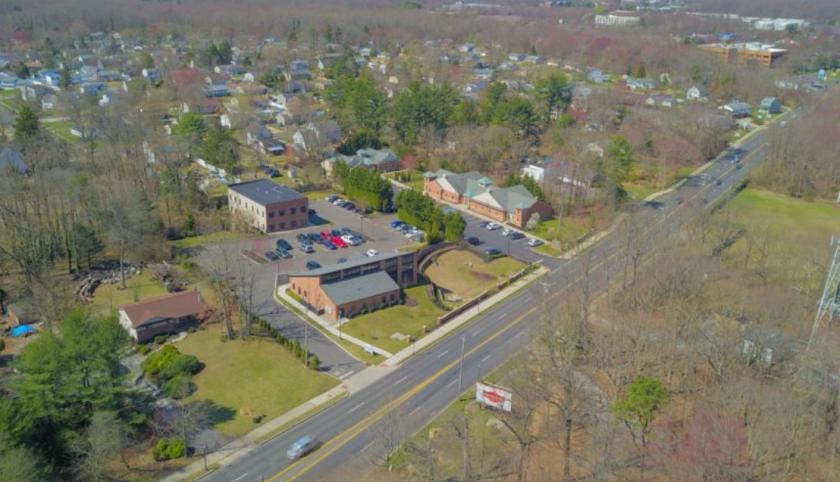
3404 W Lakeview Dr Hammonton, NJ 08037
3404 W Lakeview Dr Hammonton, NJ 08037
Details & Description
Property Highlights
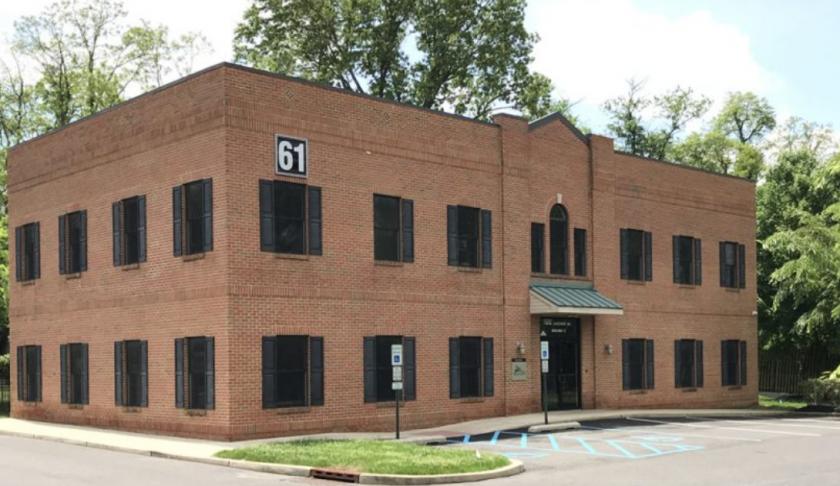
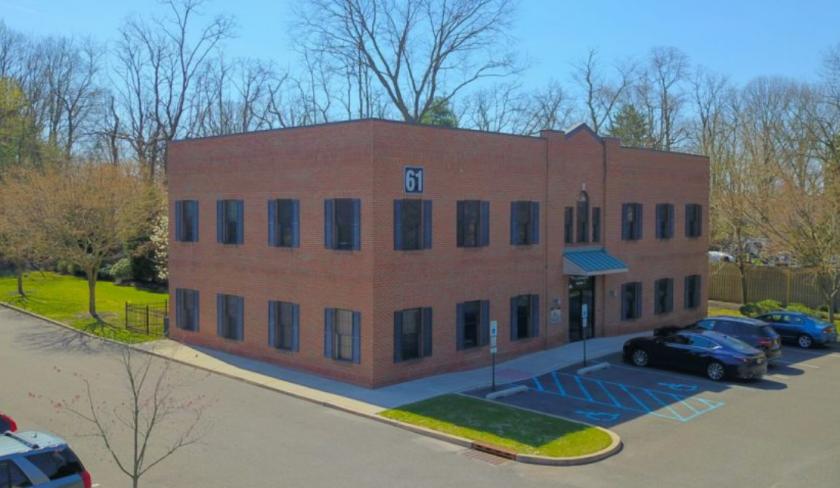
• Floorplan includes reception area, private offices, design center room, conference room, kitchenette, and bathrooms
• Easy accessibility from the parking lot with passenger elevator access to the second floor
Listing Agents

Corinne Giletto
O: 856-797-1919
corinne.giletto@vantageres.com
O: 856-797-1919
corinne.giletto@vantageres.com
While we strive to provide the most accurate information, all listing information, and demographic data, is provided by third-parties. As such, MyEListing will not be responsible for the accuracy of the information. It is strongly recommended that you verify all information with the listing agent, and any relevant agencies, prior to making any decisions.