Retail Space
2922 Atlantic Avenue Atlantic City, NJ 08401
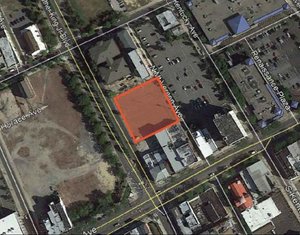
2922 Atlantic Avenue Atlantic City, NJ 08401

Details & Description
Property Highlights
• Possible development opportunity on 2nd and 3rd floors for office tenants or residential occupant
• Existing retail tenants include 7-Eleven and a mobile phone store
Listing Agents

Corinne Giletto
O: 856-797-1919
corinne.giletto@vantageres.com
O: 856-797-1919
corinne.giletto@vantageres.com
While we strive to provide the most accurate information, all listing information, and demographic data, is provided by third-parties. As such, MyEListing will not be responsible for the accuracy of the information. It is strongly recommended that you verify all information with the listing agent, and any relevant agencies, prior to making any decisions.