Commercial Land
1313 South Black Horse Pike Monroe, NJ 08094
1313 South Black Horse Pike Monroe, NJ 08094

Details & Description
Property Highlights
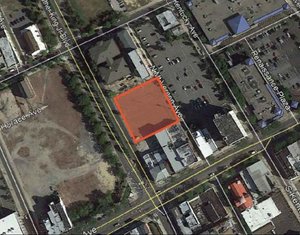
• Situated among numerous residential neighborhoods, including new developments built by Ryan Homes and Paparone Builders
• 272 ft of road frontage on highly-trafficked regional corridor connecting the Commodore Barry Bridge to Atlantic City
Listing Agents

Corinne Giletto
O: 856-797-1919
corinne.giletto@vantageres.com
O: 856-797-1919
corinne.giletto@vantageres.com
While we strive to provide the most accurate information, all listing information, and demographic data, is provided by third-parties. As such, MyEListing will not be responsible for the accuracy of the information. It is strongly recommended that you verify all information with the listing agent, and any relevant agencies, prior to making any decisions.