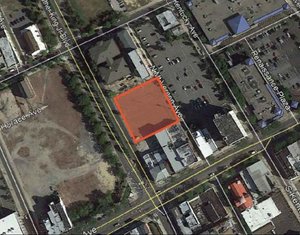
1-Mile | 3-Miles | 5-Miles | ||
---|---|---|---|---|
Total Population | 9,168 | 66,667 | 206,498 | |
Population Median Age | 37 | 40 | 40 | |
Population by Age | 0-9 Yrs | 1357 (14%) | 7937 (11%) | 23293 (11%) |
10-19 Yrs | 1093 (11%) | 7435 (11%) | 23292 (11%) | |
20-29 Yrs | 1264 (13%) | 9692 (14%) | 28996 (14%) | |
30-39 Yrs | 1359 (14%) | 8558 (12%) | 26406 (12%) | |
40-49 Yrs | 1036 (11%) | 8154 (12%) | 26912 (13%) | |
50-59 Yrs | 1360 (14%) | 9361 (14%) | 29787 (14%) | |
60-69 Yrs | 906 (9%) | 8436 (12%) | 25951 (12%) | |
70+ Yrs | 794 (8%) | 7095 (10%) | 21860 (10%) | |
Median HH Income | $62,804 | $73,585 | $73,264 | |
Total Household Income | < 24K | 681 (20%) | 3563 (14%) | 11560 (14%) |
25-49K | 710 (20%) | 5135 (20%) | 15382 (19%) | |
50-74K | 631 (18%) | 4221 (16%) | 13725 (17%) | |
75-99K | 475 (13%) | 3366 (13%) | 11373 (14%) | |
100-199K | 765 (22%) | 7019 (27%) | 21958 (27%) | |
200K+ | 140 (4%) | 2082 (8%) | 5566 (6%) | |
Highest Education Level | No Diploma | 626 | 3789 | 11631 |
Diploma or GED | 2033 | 14892 | 49903 | |
Some College | 1209 | 9250 | 30746 | |
Assoc. Degree | 702 | 4429 | 12141 | |
Bachelors Degree | 1120 | 10030 | 28855 | |
Higher Degree | 466 | 4321 | 13553 | |
Total Housing Units | 3,760 | 27,306 | 85,618 | |
--Owner-Occupied | 1,957 | 17,254 | 55,398 | |
--Renter-Occupied | 1,445 | 8,132 | 24,166 | |
Owner-Occupied Values | < 100K | 132 | 1074 | 3758 |
100-199K | 979 | 7097 | 26374 | |
200-299K | 624 | 6588 | 18728 | |
300-399K | 173 | 1908 | 4605 | |
400-499K | 25 | 248 | 971 | |
500K+ | 24 | 339 | 961 | |
Total Working Age Population | 7,092 | 53,939 | 168,693 | |
In Work Force | 4,986 | 37,141 | 115,147 | |
Not In Work Force | 2,106 | 16,798 | 53,546 | |
Workforce Employed | 4,572 | 35,023 | 108,067 | |
Workforce Unemployed | 414 | 2,105 | 7,043 | |
Civlian Workforce | 4,986 | 37,128 | 115,110 | |
Military Workforce | 0 | 13 | 37 | |
Total Households | 3,401 | 25,386 | 79,565 | |
Family Households | 2,387 | 17,011 | 51,868 | |
Non-Family Households | 1,015 | 8,375 | 27,697 | |
Married Couple | 1,605 | 12,283 | 36,714 | |
Other Family | 782 | 4,728 | 15,154 | |
Married w/Child | 645 | 4,729 | 13,779 | |
Single Male w/Child | 43 | 594 | 1,824 | |
Single Female w/Child | 352 | 1,621 | 5,193 |
Population Change Last Two Decades - Plus Projection
2000 | % | 2010 | % | 2020 | % | 2030 | |
---|---|---|---|---|---|---|---|
New Jersey | 8,414,350 | +4 | 8,791,894 | +4 | 9,132,700 | +4 | 9,530,900 |
Burlington County | 423,394 | +6 | 448,734 | 0 | 450,000 | +3 | 464,900 |
Camden County | 508,932 | +1 | 513,657 | 0 | 511,800 | +2 | 521,000 |
Gloucester County | 254,673 | +13 | 288,288 | +1 | 292,000 | +5 | 305,800 |
Salem County | 64,285 | +3 | 66,083 | -5 | 63,000 | -3 | 61,000 |
Pennsylvania | 12,281,054 | +3 | 12,702,379 | +4 | 13,230,170 | +4 | 13,759,594 |
Philadelphia County | 1,517,550 | +1 | 1,526,006 | +8 | 1,653,729 | +6 | 1,753,054 |
Total Working Age Population:
Total Households:
Total Working Age Population:
Total Households:
Total Working Age Population:
Total Households: