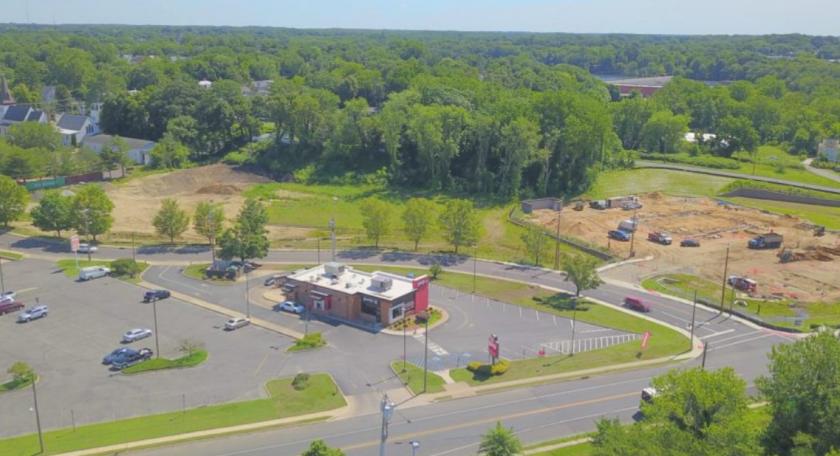
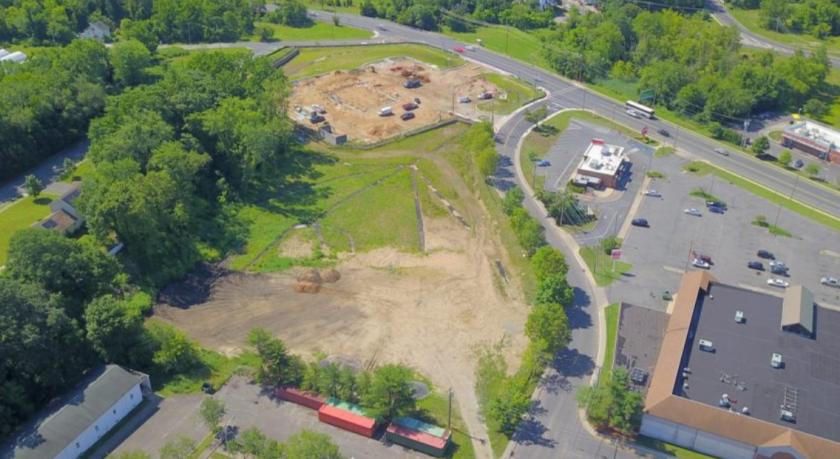
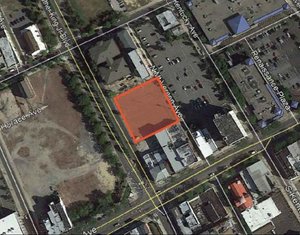
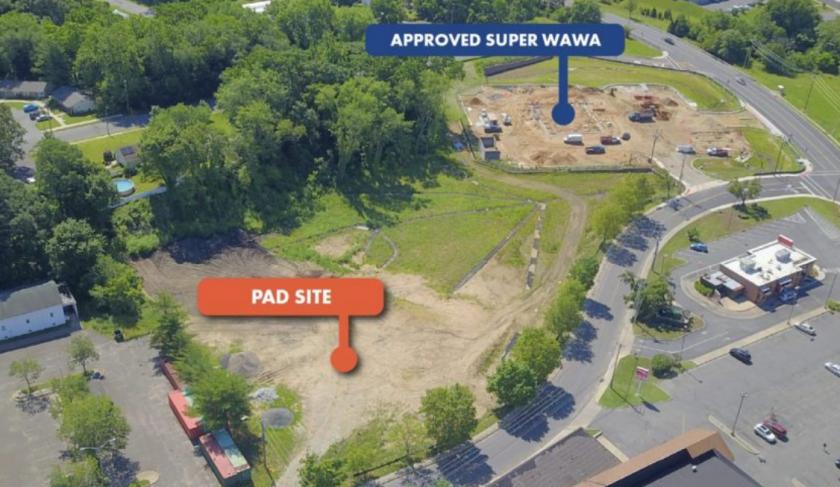
1-Mile | 3-Miles | 5-Miles | ||
---|---|---|---|---|
Total Population | 15,370 | 31,817 | 40,264 | |
Population Median Age | 31 | 34 | 35 | |
Population by Age | 0-9 Yrs | 2750 (17%) | 5037 (15%) | 5787 (14%) |
10-19 Yrs | 2482 (16%) | 4772 (14%) | 5861 (14%) | |
20-29 Yrs | 2700 (17%) | 4968 (15%) | 6017 (14%) | |
30-39 Yrs | 2498 (16%) | 4987 (15%) | 6181 (15%) | |
40-49 Yrs | 2190 (14%) | 4390 (13%) | 5462 (13%) | |
50-59 Yrs | 1183 (7%) | 3270 (10%) | 4482 (11%) | |
60-69 Yrs | 930 (6%) | 2428 (7%) | 3438 (8%) | |
70+ Yrs | 638 (4%) | 1965 (6%) | 3036 (7%) | |
Median HH Income | $36,380 | $42,781 | $49,600 | |
Total Household Income | < 24K | 1518 (36%) | 2740 (30%) | 3214 (27%) |
25-49K | 1011 (24%) | 2141 (24%) | 2646 (22%) | |
50-74K | 706 (17%) | 1500 (16%) | 1956 (16%) | |
75-99K | 416 (10%) | 1062 (11%) | 1445 (12%) | |
100-199K | 431 (10%) | 1271 (14%) | 2082 (17%) | |
200K+ | 72 (1%) | 188 (2%) | 317 (2%) | |
Highest Education Level | No Diploma | 3294 | 5844 | 6578 |
Diploma or GED | 3323 | 8121 | 10874 | |
Some College | 1303 | 3036 | 4175 | |
Assoc. Degree | 498 | 1154 | 1534 | |
Bachelors Degree | 393 | 1176 | 1944 | |
Higher Degree | 141 | 471 | 857 | |
Total Housing Units | 4,791 | 10,048 | 13,042 | |
--Owner-Occupied | 1,384 | 4,325 | 6,589 | |
--Renter-Occupied | 2,768 | 4,576 | 5,071 | |
Owner-Occupied Values | < 100K | 724 | 1333 | 1580 |
100-199K | 510 | 2098 | 3105 | |
200-299K | 76 | 596 | 1284 | |
300-399K | 18 | 145 | 355 | |
400-499K | 34 | 74 | 119 | |
500K+ | 22 | 79 | 145 | |
Total Working Age Population | 10,868 | 23,648 | 30,674 | |
In Work Force | 6,192 | 12,450 | 16,071 | |
Not In Work Force | 4,676 | 11,198 | 14,603 | |
Workforce Employed | 5,757 | 11,621 | 15,036 | |
Workforce Unemployed | 435 | 829 | 1,035 | |
Civlian Workforce | 6,192 | 12,450 | 16,071 | |
Military Workforce | 0 | 0 | 0 | |
Total Households | 4,152 | 8,902 | 11,660 | |
Family Households | 2,802 | 6,082 | 8,015 | |
Non-Family Households | 1,350 | 2,819 | 3,645 | |
Married Couple | 1,104 | 2,885 | 4,328 | |
Other Family | 1,698 | 3,197 | 3,686 | |
Married w/Child | 666 | 1,375 | 1,849 | |
Single Male w/Child | 246 | 421 | 471 | |
Single Female w/Child | 633 | 1,311 | 1,477 |
Population Change Last Two Decades - Plus Projection
2000 | % | 2010 | % | 2020 | % | 2030 | |
---|---|---|---|---|---|---|---|
Delaware | 783,600 | +15 | 897,934 | +10 | 989,803 | +6 | 1,044,965 |
Kent County | 126,697 | +28 | 162,310 | +13 | 183,242 | +6 | 193,601 |
New Jersey | 8,414,350 | +4 | 8,791,894 | +4 | 9,132,700 | +4 | 9,530,900 |
Cumberland County | 146,438 | +7 | 156,898 | +1 | 158,600 | +2 | 162,000 |
Salem County | 64,285 | +3 | 66,083 | -5 | 63,000 | -3 | 61,000 |
Total Working Age Population:
Total Households:
Total Working Age Population:
Total Households:
Total Working Age Population:
Total Households: