Commercial Land
322 Crown Point Rd West Deptford, NJ 08086
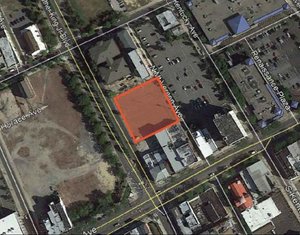
322 Crown Point Rd West Deptford, NJ 08086

Details & Description
Property Highlights
• - 1 acre of developable lot easily accessible to I-295, Route 130, NJ 44 with opportunity for growth
• Preliminary plan available for a QSR with drive thru capability
Listing Agents

Corinne Giletto
O: 856-797-1919
corinne.giletto@vantageres.com
O: 856-797-1919
corinne.giletto@vantageres.com
While we strive to provide the most accurate information, all listing information, and demographic data, is provided by third-parties. As such, MyEListing will not be responsible for the accuracy of the information. It is strongly recommended that you verify all information with the listing agent, and any relevant agencies, prior to making any decisions.