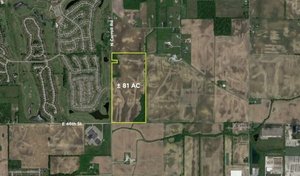
1-Mile | 3-Miles | 5-Miles | ||
---|---|---|---|---|
Total Population | 716 | 17,038 | 78,700 | |
Population Median Age | 39 | 36 | 35 | |
Population by Age | 0-9 Yrs | 102 (14%) | 2649 (15%) | 11936 (15%) |
10-19 Yrs | 91 (12%) | 2635 (15%) | 11888 (15%) | |
20-29 Yrs | 61 (8%) | 1950 (11%) | 10501 (13%) | |
30-39 Yrs | 110 (15%) | 2389 (14%) | 11409 (14%) | |
40-49 Yrs | 64 (8%) | 1897 (11%) | 9625 (12%) | |
50-59 Yrs | 155 (21%) | 2738 (16%) | 10714 (13%) | |
60-69 Yrs | 84 (11%) | 1596 (9%) | 7014 (8%) | |
70+ Yrs | 49 (6%) | 1184 (6%) | 5613 (7%) | |
Median HH Income | $95,544 | $63,748 | $53,842 | |
Total Household Income | < 24K | 14 (5%) | 970 (15%) | 6724 (22%) |
25-49K | 32 (12%) | 1346 (21%) | 6938 (23%) | |
50-74K | 46 (17%) | 1423 (22%) | 5792 (19%) | |
75-99K | 47 (18%) | 938 (14%) | 3360 (11%) | |
100-199K | 102 (39%) | 1418 (22%) | 5574 (19%) | |
200K+ | 20 (7%) | 256 (4%) | 863 (2%) | |
Highest Education Level | No Diploma | 27 | 810 | 5877 |
Diploma or GED | 135 | 3412 | 16791 | |
Some College | 86 | 2305 | 10591 | |
Assoc. Degree | 53 | 1361 | 5358 | |
Bachelors Degree | 149 | 2005 | 7833 | |
Higher Degree | 62 | 1000 | 3445 | |
Total Housing Units | 281 | 6,956 | 32,864 | |
--Owner-Occupied | 234 | 4,522 | 18,263 | |
--Renter-Occupied | 27 | 1,830 | 10,989 | |
Owner-Occupied Values | < 100K | 7 | 740 | 4586 |
100-199K | 146 | 2830 | 10235 | |
200-299K | 64 | 713 | 2306 | |
300-399K | 13 | 126 | 579 | |
400-499K | 0 | 44 | 284 | |
500K+ | 4 | 69 | 272 | |
Total Working Age Population | 557 | 12,680 | 59,365 | |
In Work Force | 396 | 9,010 | 40,708 | |
Not In Work Force | 161 | 3,671 | 18,657 | |
Workforce Employed | 385 | 8,594 | 38,069 | |
Workforce Unemployed | 11 | 416 | 2,623 | |
Civlian Workforce | 396 | 9,010 | 40,692 | |
Military Workforce | 0 | 0 | 15 | |
Total Households | 261 | 6,352 | 29,252 | |
Family Households | 198 | 4,339 | 18,700 | |
Non-Family Households | 63 | 2,013 | 10,552 | |
Married Couple | 173 | 2,994 | 11,727 | |
Other Family | 25 | 1,345 | 6,974 | |
Married w/Child | 67 | 1,098 | 4,330 | |
Single Male w/Child | 1 | 120 | 795 | |
Single Female w/Child | 14 | 847 | 4,053 |
Population Change Last Two Decades - Plus Projection
2000 | % | 2010 | % | 2020 | % | 2030 | |
---|---|---|---|---|---|---|---|
Indiana | 6,080,485 | +7 | 6,483,802 | +4 | 6,738,573 | +4 | 7,014,880 |
Hancock County | 55,391 | +26 | 70,002 | +9 | 76,353 | +11 | 85,043 |
Marion County | 860,454 | +5 | 903,393 | +7 | 963,732 | +4 | 1,001,231 |
Total Working Age Population:
Total Households:
Total Working Age Population:
Total Households:
Total Working Age Population:
Total Households: