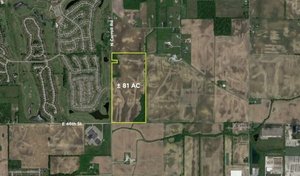
1-Mile | 3-Miles | 5-Miles | ||
---|---|---|---|---|
Total Population | 1,633 | 30,966 | 86,780 | |
Population Median Age | 36 | 38 | 37 | |
Population by Age | 0-9 Yrs | 233 (14%) | 4186 (13%) | 12242 (14%) |
10-19 Yrs | 279 (17%) | 4579 (14%) | 12544 (14%) | |
20-29 Yrs | 114 (6%) | 2798 (9%) | 8586 (9%) | |
30-39 Yrs | 299 (18%) | 4800 (15%) | 12138 (13%) | |
40-49 Yrs | 271 (16%) | 4100 (13%) | 12271 (14%) | |
50-59 Yrs | 193 (11%) | 4927 (15%) | 13237 (15%) | |
60-69 Yrs | 73 (4%) | 2965 (9%) | 8963 (10%) | |
70+ Yrs | 170 (10%) | 2611 (8%) | 6798 (7%) | |
Median HH Income | $96,652 | $98,261 | $101,844 | |
Total Household Income | < 24K | 23 (3%) | 897 (8%) | 2724 (8%) |
25-49K | 57 (9%) | 1282 (11%) | 3870 (12%) | |
50-74K | 95 (16%) | 1600 (14%) | 4206 (13%) | |
75-99K | 134 (22%) | 1928 (17%) | 4469 (14%) | |
100-199K | 217 (37%) | 3815 (34%) | 10469 (33%) | |
200K+ | 57 (9%) | 1625 (14%) | 5347 (17%) | |
Highest Education Level | No Diploma | 21 | 941 | 2595 |
Diploma or GED | 180 | 3708 | 9970 | |
Some College | 226 | 3435 | 9503 | |
Assoc. Degree | 71 | 1553 | 4409 | |
Bachelors Degree | 461 | 7694 | 20615 | |
Higher Degree | 118 | 3679 | 10868 | |
Total Housing Units | 601 | 11,545 | 32,440 | |
--Owner-Occupied | 523 | 10,015 | 27,298 | |
--Renter-Occupied | 59 | 1,132 | 3,788 | |
Owner-Occupied Values | < 100K | 28 | 534 | 1464 |
100-199K | 141 | 4110 | 9553 | |
200-299K | 225 | 2398 | 6172 | |
300-399K | 94 | 1344 | 4209 | |
400-499K | 24 | 736 | 2425 | |
500K+ | 12 | 893 | 3474 | |
Total Working Age Population | 1,247 | 24,007 | 66,848 | |
In Work Force | 887 | 17,481 | 48,325 | |
Not In Work Force | 359 | 6,526 | 18,524 | |
Workforce Employed | 872 | 16,925 | 46,643 | |
Workforce Unemployed | 9 | 494 | 1,566 | |
Civlian Workforce | 880 | 17,419 | 48,208 | |
Military Workforce | 7 | 62 | 117 | |
Total Households | 583 | 11,147 | 31,085 | |
Family Households | 456 | 8,137 | 23,170 | |
Non-Family Households | 127 | 3,010 | 7,915 | |
Married Couple | 379 | 6,910 | 19,706 | |
Other Family | 77 | 1,226 | 3,465 | |
Married w/Child | 180 | 2,912 | 8,717 | |
Single Male w/Child | 22 | 147 | 541 | |
Single Female w/Child | 38 | 546 | 1,435 |
Population Change Last Two Decades - Plus Projection
2000 | % | 2010 | % | 2020 | % | 2030 | |
---|---|---|---|---|---|---|---|
Indiana | 6,080,485 | +7 | 6,483,802 | +4 | 6,738,573 | +4 | 7,014,880 |
Hamilton County | 182,740 | +50 | 274,569 | +25 | 343,179 | +22 | 417,754 |
Hancock County | 55,391 | +26 | 70,002 | +9 | 76,353 | +11 | 85,043 |
Madison County | 133,358 | -1 | 131,636 | -3 | 127,604 | -3 | 124,262 |
Marion County | 860,454 | +5 | 903,393 | +7 | 963,732 | +4 | 1,001,231 |
Total Working Age Population:
Total Households:
Total Working Age Population:
Total Households:
Total Working Age Population:
Total Households: