Commercial Land
Hollywood Rd St Joseph, MI 49085
Hollywood Rd St Joseph, MI 49085
Details & Description
Property Highlights
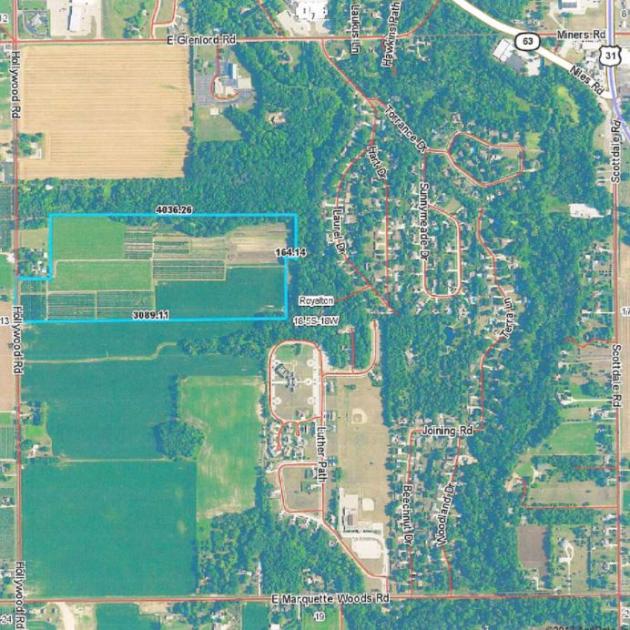
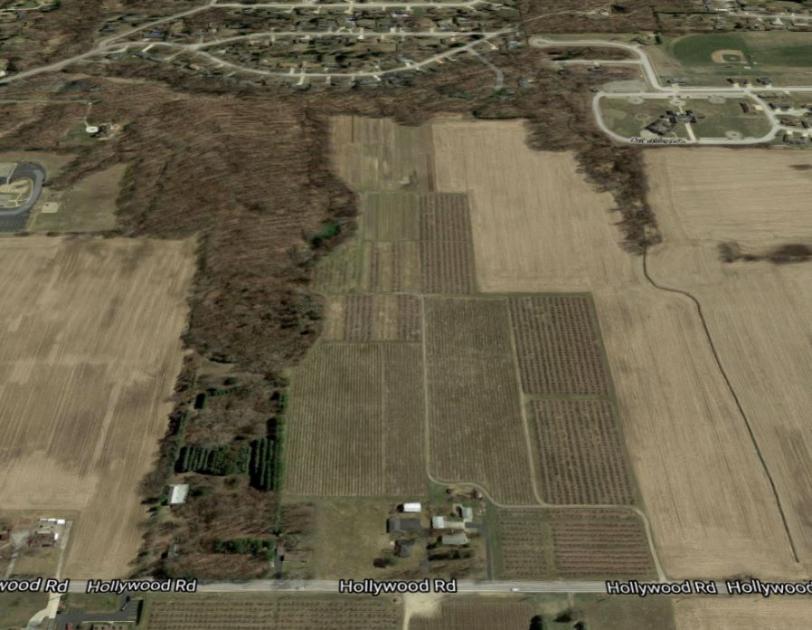
• Subject property is located approximately 1 miles south of the I-94 and Nile Road interexchange on Hollywood Road
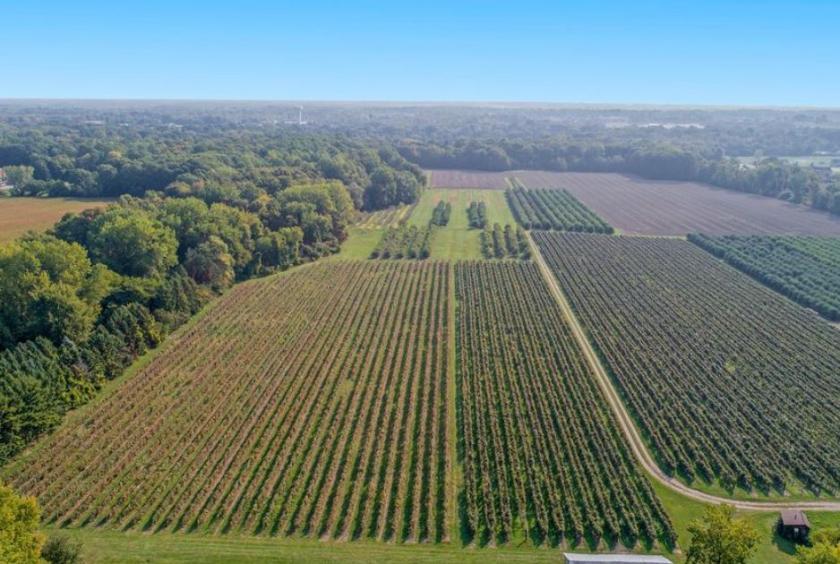
• Transitional land ideal for residential, multi-family, or medical office development
Additional Photos

Listing Agents

Matt Wetzel
O: 574-970-9006
mwetzel@bradleyco.com
O: 574-970-9006
mwetzel@bradleyco.com
While we strive to provide the most accurate information, all listing information, and demographic data, is provided by third-parties. As such, MyEListing will not be responsible for the accuracy of the information. It is strongly recommended that you verify all information with the listing agent, and any relevant agencies, prior to making any decisions.


