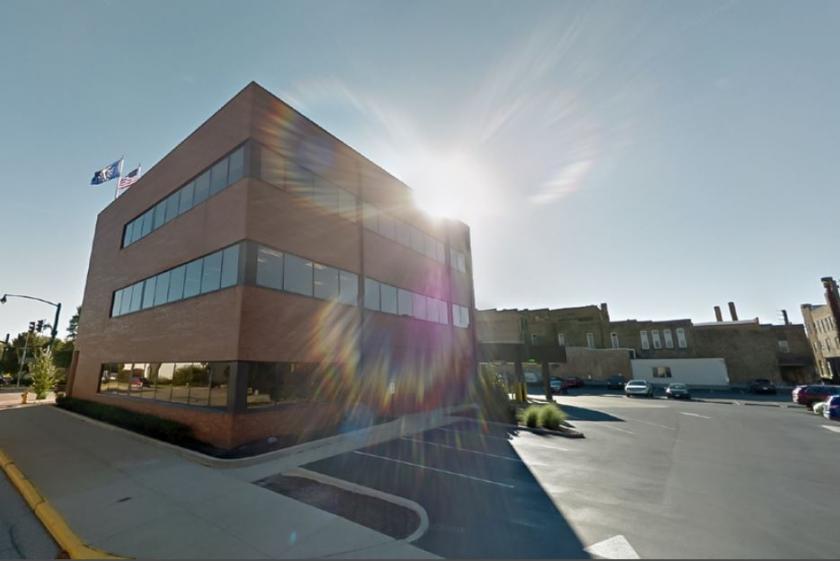
1-Mile | 3-Miles | 5-Miles | ||
---|---|---|---|---|
Total Population | 13,066 | 58,153 | 102,855 | |
Population Median Age | 34 | 36 | 37 | |
Population by Age | 0-9 Yrs | 2402 (18%) | 9108 (15%) | 15330 (14%) |
10-19 Yrs | 1808 (13%) | 8381 (14%) | 14971 (14%) | |
20-29 Yrs | 1898 (14%) | 8005 (13%) | 13013 (12%) | |
30-39 Yrs | 1725 (13%) | 7316 (12%) | 12849 (12%) | |
40-49 Yrs | 1503 (11%) | 6869 (11%) | 12620 (12%) | |
50-59 Yrs | 1506 (11%) | 7710 (13%) | 13601 (13%) | |
60-69 Yrs | 1160 (8%) | 5413 (9%) | 10575 (10%) | |
70+ Yrs | 1065 (8%) | 5351 (9%) | 9898 (9%) | |
Median HH Income | $32,686 | $44,481 | $50,557 | |
Total Household Income | < 24K | 1821 (37%) | 6471 (29%) | 8967 (23%) |
25-49K | 1526 (31%) | 5924 (26%) | 9863 (25%) | |
50-74K | 734 (14%) | 4275 (19%) | 7567 (19%) | |
75-99K | 297 (6%) | 2643 (12%) | 5274 (13%) | |
100-199K | 498 (10%) | 2420 (10%) | 5491 (14%) | |
200K+ | 33 (0%) | 285 (1%) | 857 (2%) | |
Highest Education Level | No Diploma | 2333 | 8525 | 12494 |
Diploma or GED | 2672 | 13232 | 24127 | |
Some College | 1605 | 7511 | 13820 | |
Assoc. Degree | 427 | 2340 | 4571 | |
Bachelors Degree | 792 | 3915 | 7863 | |
Higher Degree | 321 | 1849 | 3718 | |
Total Housing Units | 6,149 | 25,609 | 43,302 | |
--Owner-Occupied | 2,148 | 12,943 | 25,157 | |
--Renter-Occupied | 2,760 | 9,074 | 12,860 | |
Owner-Occupied Values | < 100K | 1540 | 6399 | 8547 |
100-199K | 533 | 5164 | 12095 | |
200-299K | 1 | 760 | 2722 | |
300-399K | 2 | 293 | 1008 | |
400-499K | 0 | 7 | 124 | |
500K+ | 72 | 320 | 660 | |
Total Working Age Population | 9,556 | 43,806 | 78,511 | |
In Work Force | 5,893 | 27,949 | 50,291 | |
Not In Work Force | 3,662 | 15,857 | 28,220 | |
Workforce Employed | 5,318 | 25,860 | 47,389 | |
Workforce Unemployed | 576 | 2,089 | 2,881 | |
Civlian Workforce | 5,893 | 27,949 | 50,271 | |
Military Workforce | 0 | 0 | 21 | |
Total Households | 4,909 | 22,017 | 38,017 | |
Family Households | 2,664 | 13,393 | 24,780 | |
Non-Family Households | 2,245 | 8,624 | 13,237 | |
Married Couple | 1,379 | 8,357 | 16,967 | |
Other Family | 1,285 | 5,037 | 7,813 | |
Married w/Child | 598 | 3,493 | 6,814 | |
Single Male w/Child | 223 | 825 | 1,300 | |
Single Female w/Child | 657 | 2,459 | 3,566 |
Population Change Last Two Decades - Plus Projection
2000 | % | 2010 | % | 2020 | % | 2030 | |
---|---|---|---|---|---|---|---|
Indiana | 6,080,485 | +7 | 6,483,802 | +4 | 6,738,573 | +4 | 7,014,880 |
Elkhart County | 182,791 | +8 | 197,559 | +6 | 209,690 | +7 | 223,392 |
St. Joseph County | 265,559 | +1 | 266,931 | +1 | 269,113 | +1 | 271,912 |
Michigan | 9,938,444 | -1 | 9,883,640 | +1 | 10,023,423 | +4 | 10,424,510 |
Cass County | 51,104 | +2 | 52,293 | -2 | 51,383 | +3 | 53,143 |
Total Working Age Population:
Total Households:
Total Working Age Population:
Total Households:
Total Working Age Population:
Total Households: