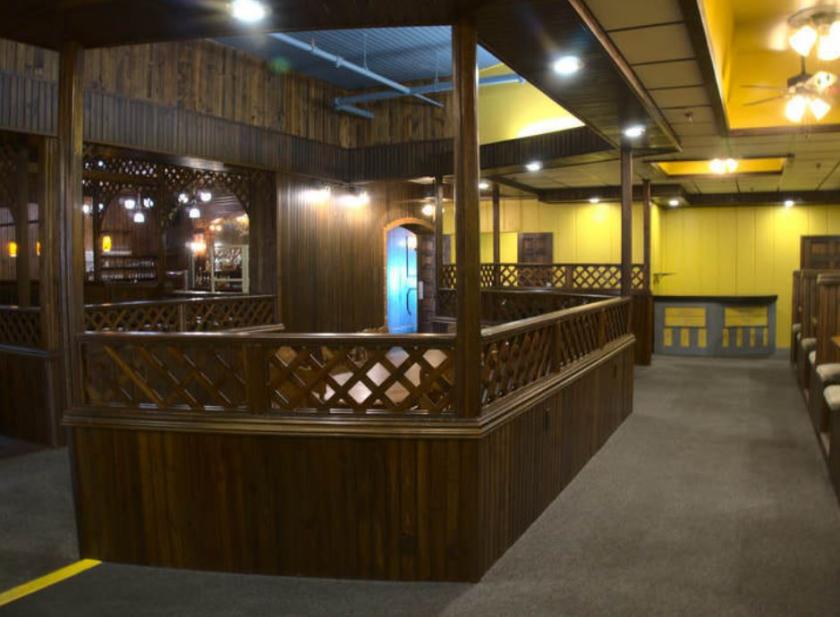
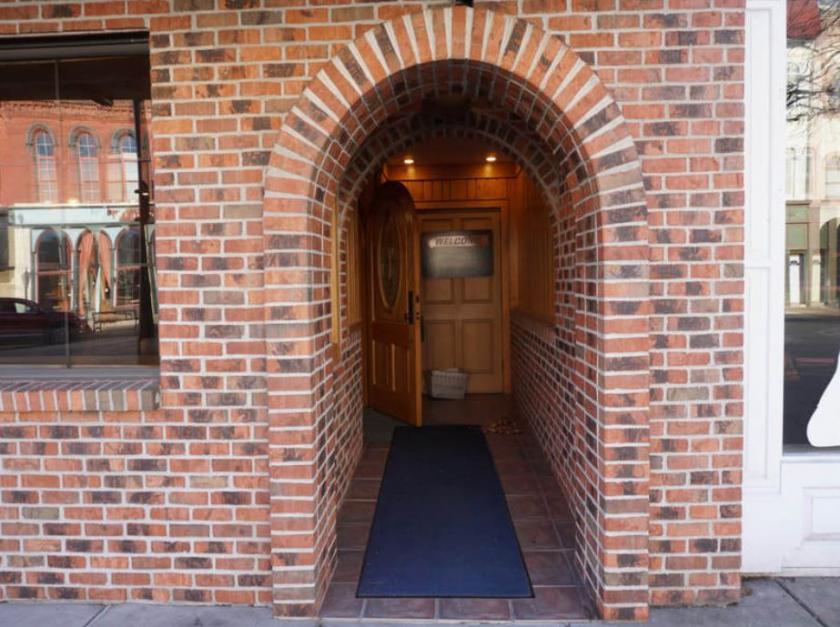
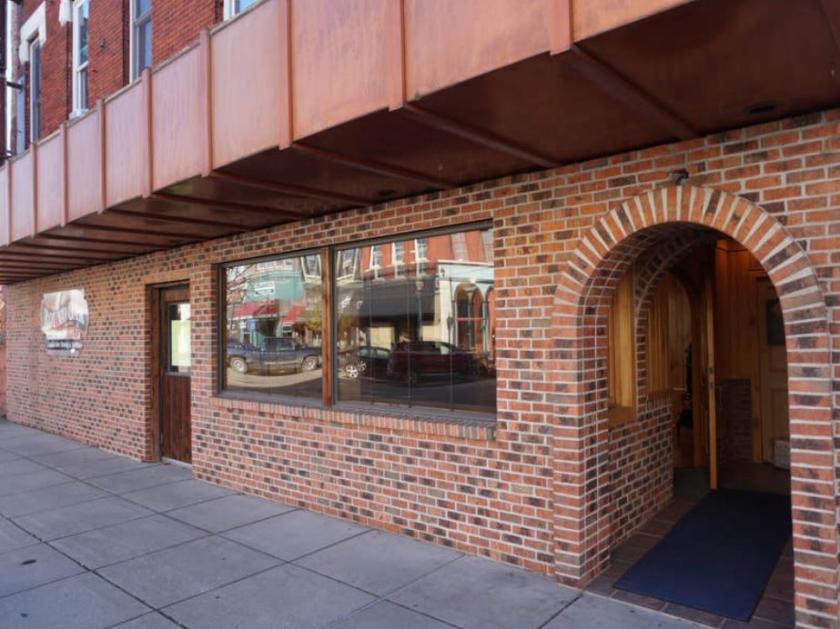
1-Mile | 3-Miles | 5-Miles | ||
---|---|---|---|---|
Total Population | 3,191 | 7,789 | 11,306 | |
Population Median Age | 36 | 38 | 39 | |
Population by Age | 0-9 Yrs | 466 (14%) | 1089 (13%) | 1367 (12%) |
10-19 Yrs | 418 (13%) | 1121 (14%) | 1710 (15%) | |
20-29 Yrs | 510 (15%) | 1049 (13%) | 1371 (12%) | |
30-39 Yrs | 430 (13%) | 924 (11%) | 1241 (10%) | |
40-49 Yrs | 392 (12%) | 913 (11%) | 1421 (12%) | |
50-59 Yrs | 367 (11%) | 956 (12%) | 1448 (12%) | |
60-69 Yrs | 351 (10%) | 967 (12%) | 1550 (13%) | |
70+ Yrs | 257 (8%) | 770 (9%) | 1199 (10%) | |
Median HH Income | $34,636 | $40,049 | $43,819 | |
Total Household Income | < 24K | 523 (35%) | 1096 (32%) | 1306 (27%) |
25-49K | 463 (31%) | 1021 (30%) | 1415 (29%) | |
50-74K | 222 (14%) | 514 (15%) | 876 (18%) | |
75-99K | 159 (10%) | 364 (10%) | 535 (11%) | |
100-199K | 109 (7%) | 287 (8%) | 494 (10%) | |
200K+ | 14 (0%) | 68 (2%) | 111 (2%) | |
Highest Education Level | No Diploma | 398 | 944 | 1350 |
Diploma or GED | 620 | 1561 | 2486 | |
Some College | 670 | 1509 | 2039 | |
Assoc. Degree | 256 | 577 | 855 | |
Bachelors Degree | 141 | 409 | 677 | |
Higher Degree | 45 | 166 | 280 | |
Total Housing Units | 1,717 | 3,754 | 5,458 | |
--Owner-Occupied | 747 | 1,984 | 3,095 | |
--Renter-Occupied | 742 | 1,366 | 1,642 | |
Owner-Occupied Values | < 100K | 542 | 1236 | 1690 |
100-199K | 155 | 534 | 976 | |
200-299K | 30 | 121 | 298 | |
300-399K | 9 | 43 | 53 | |
400-499K | 10 | 37 | 53 | |
500K+ | 2 | 12 | 24 | |
Total Working Age Population | 2,467 | 6,035 | 9,003 | |
In Work Force | 1,578 | 3,637 | 5,366 | |
Not In Work Force | 889 | 2,397 | 3,636 | |
Workforce Employed | 1,412 | 3,251 | 4,806 | |
Workforce Unemployed | 166 | 386 | 561 | |
Civlian Workforce | 1,578 | 3,637 | 5,366 | |
Military Workforce | 0 | 0 | 0 | |
Total Households | 1,489 | 3,350 | 4,736 | |
Family Households | 723 | 1,919 | 2,906 | |
Non-Family Households | 766 | 1,431 | 1,830 | |
Married Couple | 312 | 1,014 | 1,797 | |
Other Family | 411 | 905 | 1,109 | |
Married w/Child | 127 | 350 | 619 | |
Single Male w/Child | 89 | 165 | 225 | |
Single Female w/Child | 199 | 410 | 472 |
Population Change Last Two Decades - Plus Projection
2000 | % | 2010 | % | 2020 | % | 2030 | |
---|---|---|---|---|---|---|---|
Michigan | 9,938,444 | -1 | 9,883,640 | +1 | 10,023,423 | +4 | 10,424,510 |
Cass County | 51,104 | +2 | 52,293 | -2 | 51,383 | +3 | 53,143 |
Total Working Age Population:
Total Households:
Total Working Age Population:
Total Households:
Total Working Age Population:
Total Households: