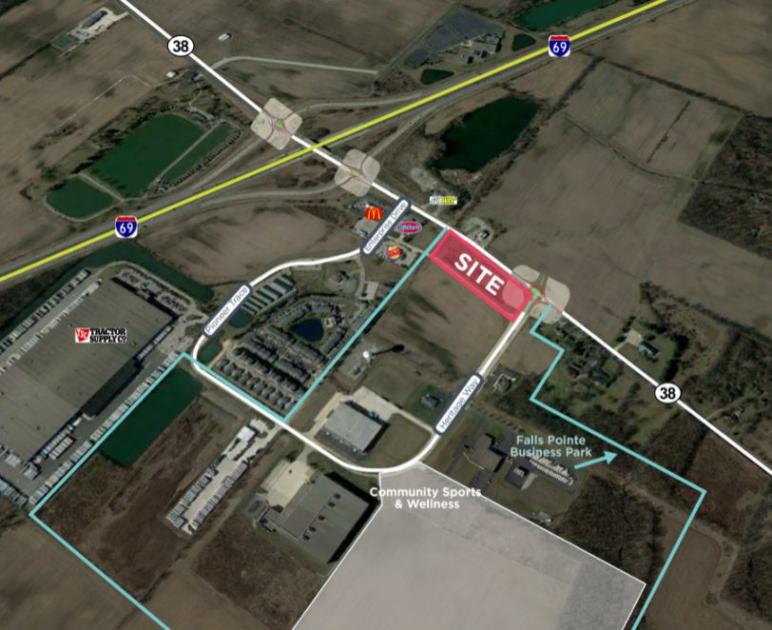
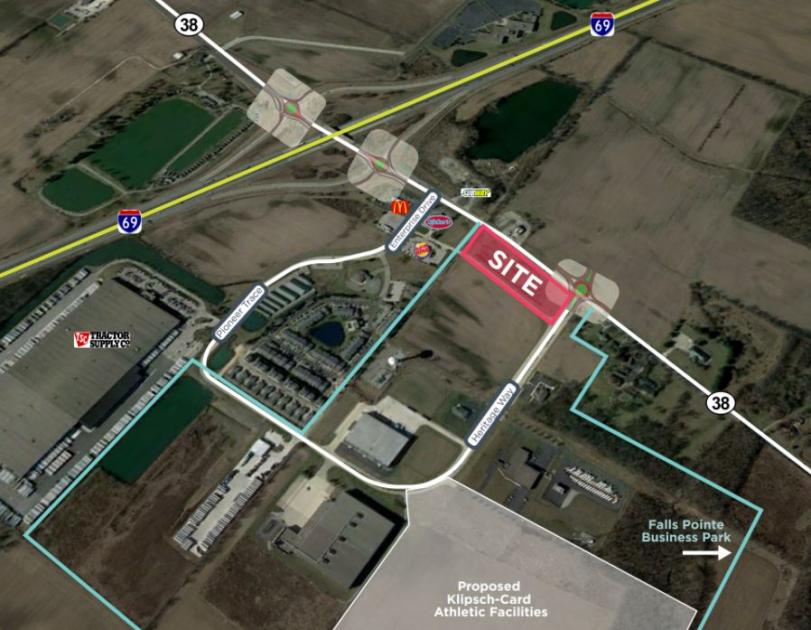
1-Mile | 3-Miles | 5-Miles | ||
---|---|---|---|---|
Total Population | 1,645 | 11,133 | 22,631 | |
Population Median Age | 40 | 39 | 39 | |
Population by Age | 0-9 Yrs | 54 (3%) | 882 (7%) | 2261 (9%) |
10-19 Yrs | 103 (6%) | 1280 (11%) | 3174 (14%) | |
20-29 Yrs | 325 (19%) | 1622 (14%) | 2841 (12%) | |
30-39 Yrs | 394 (23%) | 2090 (18%) | 3552 (15%) | |
40-49 Yrs | 299 (18%) | 1724 (15%) | 3143 (13%) | |
50-59 Yrs | 287 (17%) | 1684 (15%) | 3227 (14%) | |
60-69 Yrs | 98 (5%) | 1041 (9%) | 2426 (10%) | |
70+ Yrs | 86 (5%) | 810 (7%) | 2006 (8%) | |
Median HH Income | $67,874 | $74,130 | $71,497 | |
Total Household Income | < 24K | 40 (15%) | 429 (14%) | 1038 (14%) |
25-49K | 50 (19%) | 465 (15%) | 1340 (18%) | |
50-74K | 65 (24%) | 624 (20%) | 1398 (19%) | |
75-99K | 43 (16%) | 441 (14%) | 1005 (14%) | |
100-199K | 55 (20%) | 896 (30%) | 2036 (28%) | |
200K+ | 11 (4%) | 132 (4%) | 302 (4%) | |
Highest Education Level | No Diploma | 257 | 1039 | 1575 |
Diploma or GED | 466 | 2772 | 5706 | |
Some College | 329 | 1935 | 3620 | |
Assoc. Degree | 91 | 614 | 1398 | |
Bachelors Degree | 156 | 1378 | 2584 | |
Higher Degree | 52 | 555 | 1189 | |
Total Housing Units | 282 | 3,227 | 7,700 | |
--Owner-Occupied | 198 | 2,405 | 5,932 | |
--Renter-Occupied | 65 | 582 | 1,187 | |
Owner-Occupied Values | < 100K | 28 | 344 | 1338 |
100-199K | 117 | 1366 | 2980 | |
200-299K | 41 | 423 | 844 | |
300-399K | 8 | 172 | 479 | |
400-499K | 0 | 37 | 136 | |
500K+ | 5 | 63 | 154 | |
Total Working Age Population | 1,531 | 9,489 | 18,417 | |
In Work Force | 353 | 4,091 | 9,752 | |
Not In Work Force | 1,178 | 5,398 | 8,666 | |
Workforce Employed | 336 | 3,936 | 9,353 | |
Workforce Unemployed | 17 | 152 | 374 | |
Civlian Workforce | 353 | 4,089 | 9,727 | |
Military Workforce | 0 | 2 | 25 | |
Total Households | 263 | 2,986 | 7,119 | |
Family Households | 187 | 2,218 | 5,392 | |
Non-Family Households | 76 | 768 | 1,727 | |
Married Couple | 148 | 1,783 | 4,220 | |
Other Family | 39 | 435 | 1,172 | |
Married w/Child | 64 | 792 | 1,772 | |
Single Male w/Child | 7 | 115 | 249 | |
Single Female w/Child | 18 | 195 | 483 |
Population Change Last Two Decades - Plus Projection
2000 | % | 2010 | % | 2020 | % | 2030 | |
---|---|---|---|---|---|---|---|
Indiana | 6,080,485 | +7 | 6,483,802 | +4 | 6,738,573 | +4 | 7,014,880 |
Hancock County | 55,391 | +26 | 70,002 | +9 | 76,353 | +11 | 85,043 |
Madison County | 133,358 | -1 | 131,636 | -3 | 127,604 | -3 | 124,262 |
Total Working Age Population:
Total Households:
Total Working Age Population:
Total Households:
Total Working Age Population:
Total Households: