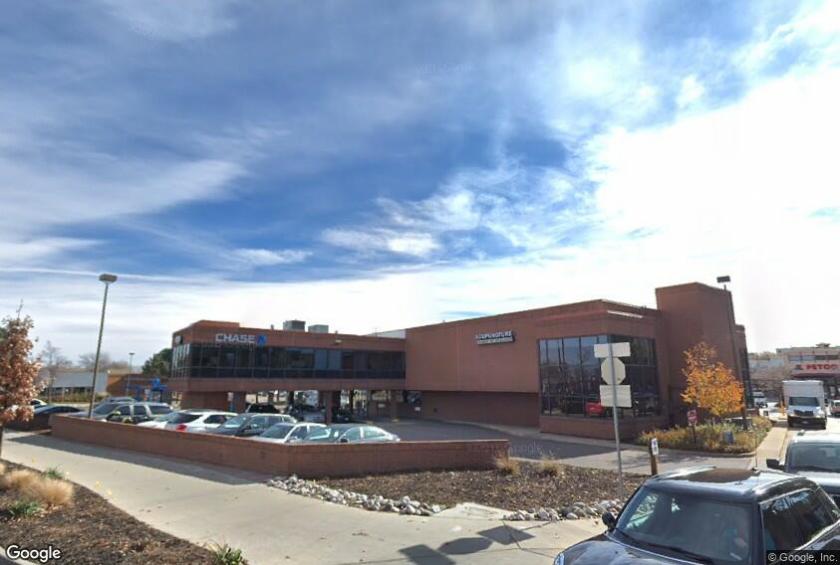
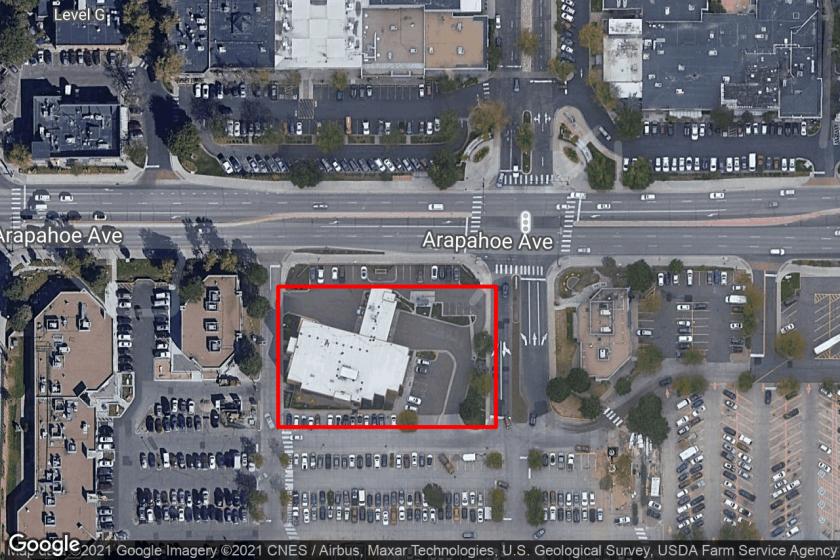
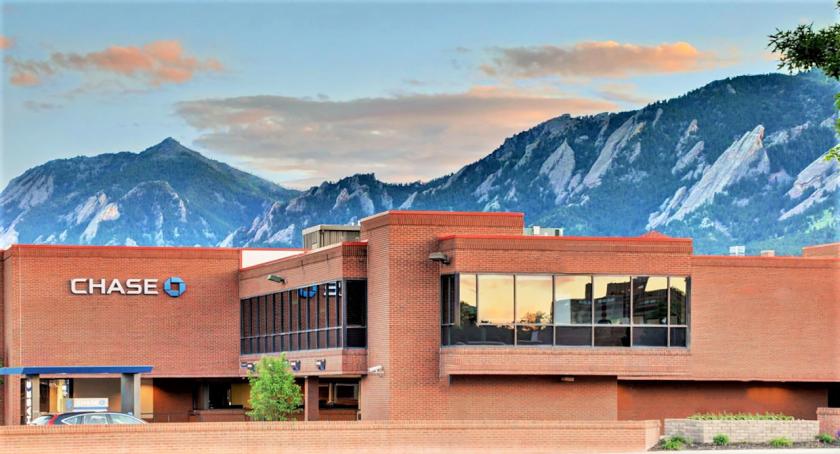
1-Mile | 3-Miles | 5-Miles | ||
---|---|---|---|---|
Total Population | 28,469 | 98,019 | 119,109 | |
Population Median Age | 28 | 35 | 36 | |
Population by Age | 0-9 Yrs | 785 (2%) | 5937 (6%) | 7724 (6%) |
10-19 Yrs | 6596 (23%) | 15099 (15%) | 17334 (14%) | |
20-29 Yrs | 14179 (49%) | 31816 (32%) | 34956 (29%) | |
30-39 Yrs | 2755 (9%) | 11506 (11%) | 14590 (12%) | |
40-49 Yrs | 1124 (3%) | 8858 (9%) | 11817 (9%) | |
50-59 Yrs | 1055 (3%) | 9109 (9%) | 12138 (10%) | |
60-69 Yrs | 950 (3%) | 8305 (8%) | 11243 (9%) | |
70+ Yrs | 1025 (3%) | 7388 (7%) | 9307 (7%) | |
Median HH Income | $35,250 | $66,797 | $71,896 | |
Total Household Income | < 24K | 4168 (39%) | 8541 (22%) | 9536 (20%) |
25-49K | 2455 (23%) | 6876 (17%) | 8135 (17%) | |
50-74K | 1502 (14%) | 5537 (14%) | 6920 (14%) | |
75-99K | 814 (7%) | 3605 (9%) | 4656 (9%) | |
100-199K | 1214 (11%) | 8378 (21%) | 10975 (23%) | |
200K+ | 493 (4%) | 5615 (14%) | 7384 (15%) | |
Highest Education Level | No Diploma | 255 | 1682 | 2112 |
Diploma or GED | 541 | 3503 | 4648 | |
Some College | 1314 | 6089 | 8034 | |
Assoc. Degree | 426 | 1889 | 2751 | |
Bachelors Degree | 3744 | 20334 | 26202 | |
Higher Degree | 3759 | 21810 | 27258 | |
Total Housing Units | 11,833 | 41,325 | 50,864 | |
--Owner-Occupied | 2,022 | 18,370 | 24,514 | |
--Renter-Occupied | 8,625 | 20,182 | 23,092 | |
Owner-Occupied Values | < 100K | 85 | 1118 | 1483 |
100-199K | 208 | 720 | 1147 | |
200-299K | 199 | 761 | 1107 | |
300-399K | 239 | 1139 | 1658 | |
400-499K | 98 | 1227 | 1720 | |
500K+ | 1193 | 13407 | 17398 | |
Total Working Age Population | 27,377 | 88,021 | 106,047 | |
In Work Force | 16,161 | 57,759 | 70,259 | |
Not In Work Force | 11,215 | 30,262 | 35,789 | |
Workforce Employed | 15,322 | 55,167 | 67,179 | |
Workforce Unemployed | 822 | 2,574 | 3,062 | |
Civlian Workforce | 16,143 | 57,741 | 70,241 | |
Military Workforce | 18 | 18 | 18 | |
Total Households | 10,647 | 38,552 | 47,606 | |
Family Households | 2,105 | 15,813 | 20,861 | |
Non-Family Households | 8,541 | 22,739 | 26,745 | |
Married Couple | 1,564 | 13,021 | 17,214 | |
Other Family | 542 | 2,792 | 3,647 | |
Married w/Child | 587 | 5,204 | 6,746 | |
Single Male w/Child | 53 | 494 | 579 | |
Single Female w/Child | 133 | 964 | 1,369 |
Population Change Last Two Decades - Plus Projection
2000 | % | 2010 | % | 2020 | % | 2030 | |
---|---|---|---|---|---|---|---|
Colorado | 4,301,261 | +17 | 5,029,196 | +16 | 5,838,181 | +15 | 6,733,658 |
Boulder County | 291,288 | +1 | 294,567 | +13 | 332,134 | +12 | 370,618 |
Total Working Age Population:
Total Households:
Total Working Age Population:
Total Households:
Total Working Age Population:
Total Households: