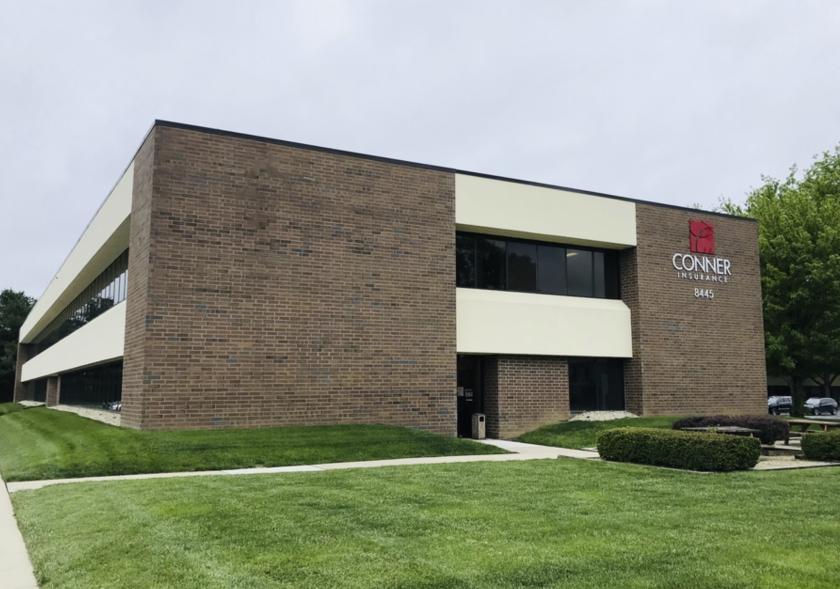
1-Mile | 3-Miles | 5-Miles | ||
---|---|---|---|---|
Total Population | 5,844 | 59,210 | 190,734 | |
Population Median Age | 46 | 41 | 39 | |
Population by Age | 0-9 Yrs | 148 (2%) | 5233 (8%) | 21676 (11%) |
10-19 Yrs | 352 (6%) | 6080 (10%) | 21024 (11%) | |
20-29 Yrs | 1466 (25%) | 10059 (16%) | 30030 (15%) | |
30-39 Yrs | 727 (12%) | 8325 (14%) | 29046 (15%) | |
40-49 Yrs | 653 (11%) | 7484 (12%) | 22879 (11%) | |
50-59 Yrs | 540 (9%) | 7082 (11%) | 23211 (12%) | |
60-69 Yrs | 728 (12%) | 7552 (12%) | 21800 (11%) | |
70+ Yrs | 1230 (21%) | 7395 (12%) | 21070 (11%) | |
Median HH Income | $83,769 | $71,280 | $66,560 | |
Total Household Income | < 24K | 491 (15%) | 4156 (14%) | 13150 (15%) |
25-49K | 626 (20%) | 6285 (22%) | 19844 (23%) | |
50-74K | 287 (9%) | 4292 (15%) | 14291 (16%) | |
75-99K | 432 (13%) | 3742 (13%) | 10547 (12%) | |
100-199K | 871 (28%) | 6744 (23%) | 19166 (22%) | |
200K+ | 404 (12%) | 2980 (10%) | 8450 (9%) | |
Highest Education Level | No Diploma | 36 | 1694 | 6044 |
Diploma or GED | 653 | 6374 | 19904 | |
Some College | 661 | 7221 | 23818 | |
Assoc. Degree | 409 | 2653 | 8739 | |
Bachelors Degree | 1941 | 16392 | 48531 | |
Higher Degree | 1195 | 9971 | 29422 | |
Total Housing Units | 3,548 | 30,502 | 92,755 | |
--Owner-Occupied | 1,500 | 15,008 | 47,612 | |
--Renter-Occupied | 1,610 | 13,190 | 37,835 | |
Owner-Occupied Values | < 100K | 20 | 727 | 2830 |
100-199K | 452 | 5282 | 18738 | |
200-299K | 327 | 3823 | 12166 | |
300-399K | 225 | 2295 | 6546 | |
400-499K | 99 | 1201 | 2813 | |
500K+ | 377 | 1682 | 4519 | |
Total Working Age Population | 5,450 | 49,874 | 155,520 | |
In Work Force | 3,653 | 35,488 | 111,145 | |
Not In Work Force | 1,797 | 14,386 | 44,375 | |
Workforce Employed | 3,512 | 34,409 | 107,606 | |
Workforce Unemployed | 141 | 1,025 | 3,444 | |
Civlian Workforce | 3,653 | 35,434 | 111,050 | |
Military Workforce | 0 | 54 | 96 | |
Total Households | 3,110 | 28,198 | 85,447 | |
Family Households | 1,164 | 13,203 | 43,585 | |
Non-Family Households | 1,946 | 14,995 | 41,862 | |
Married Couple | 973 | 10,805 | 33,716 | |
Other Family | 191 | 2,398 | 9,869 | |
Married w/Child | 162 | 3,808 | 12,601 | |
Single Male w/Child | 0 | 238 | 980 | |
Single Female w/Child | 52 | 1,012 | 5,065 |
Population Change Last Two Decades - Plus Projection
2000 | % | 2010 | % | 2020 | % | 2030 | |
---|---|---|---|---|---|---|---|
Indiana | 6,080,485 | +7 | 6,483,802 | +4 | 6,738,573 | +4 | 7,014,880 |
Hamilton County | 182,740 | +50 | 274,569 | +25 | 343,179 | +22 | 417,754 |
Marion County | 860,454 | +5 | 903,393 | +7 | 963,732 | +4 | 1,001,231 |
Total Working Age Population:
Total Households:
Total Working Age Population:
Total Households:
Total Working Age Population:
Total Households: