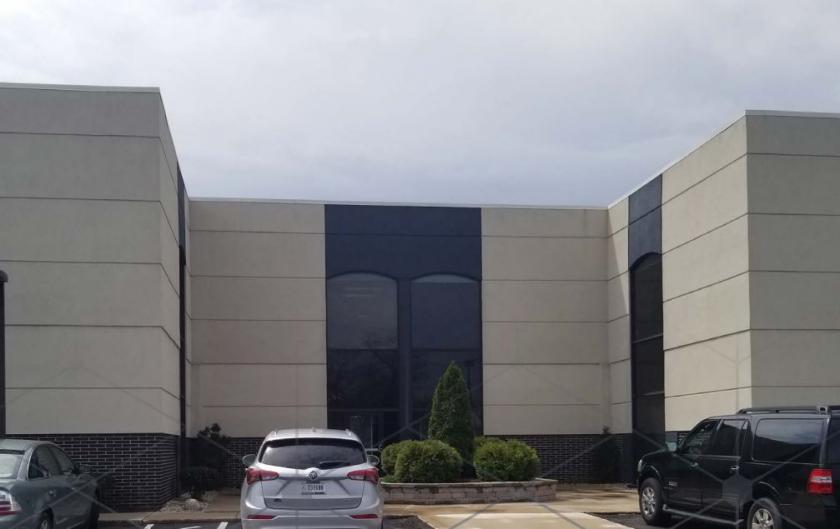
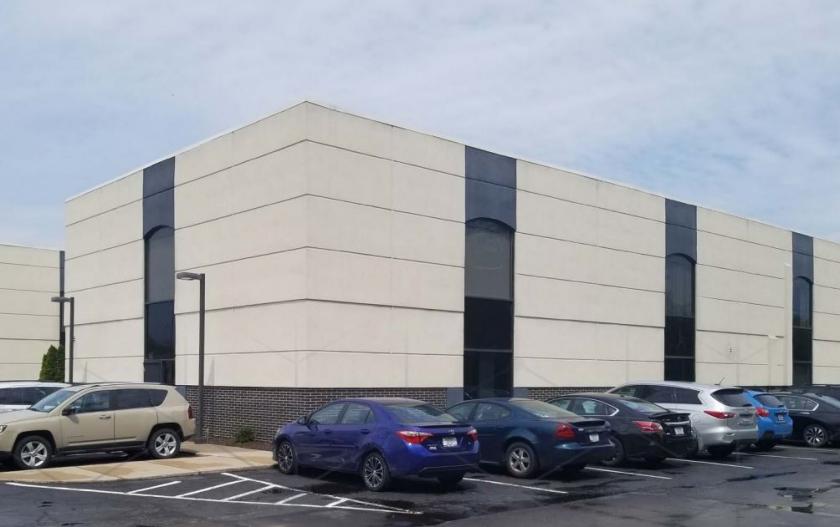
Office Space
7863 Broadway Merrillville, IN 46410
7863 Broadway Merrillville, IN 46410
Details & Description
Property Highlights
• Significant redevelopment project planned for the northwest quadrant of I-65 and US 30
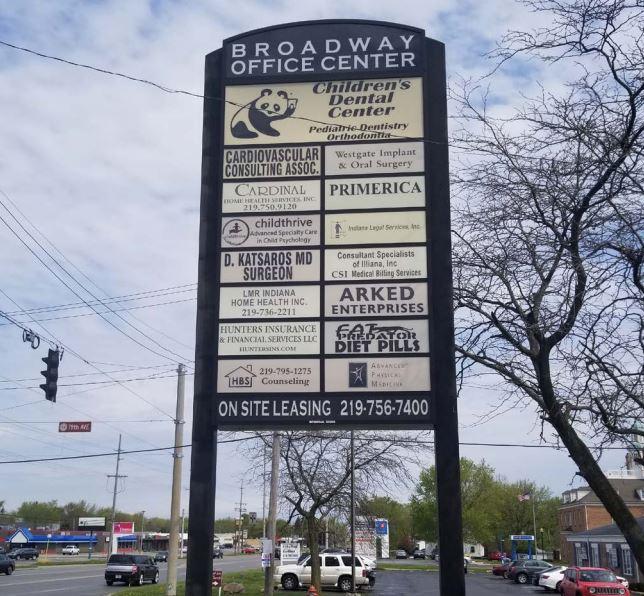
• Signalized corner location in the heart of Merrillville near I-65US 30 interchange
Listing Agents

Steve Nicksic
O: 219-695-3160
M: 219-508-0554
snicksic@bradleyco.com
O: 219-695-3160
M: 219-508-0554
snicksic@bradleyco.com
While we strive to provide the most accurate information, all listing information, and demographic data, is provided by third-parties. As such, MyEListing will not be responsible for the accuracy of the information. It is strongly recommended that you verify all information with the listing agent, and any relevant agencies, prior to making any decisions.