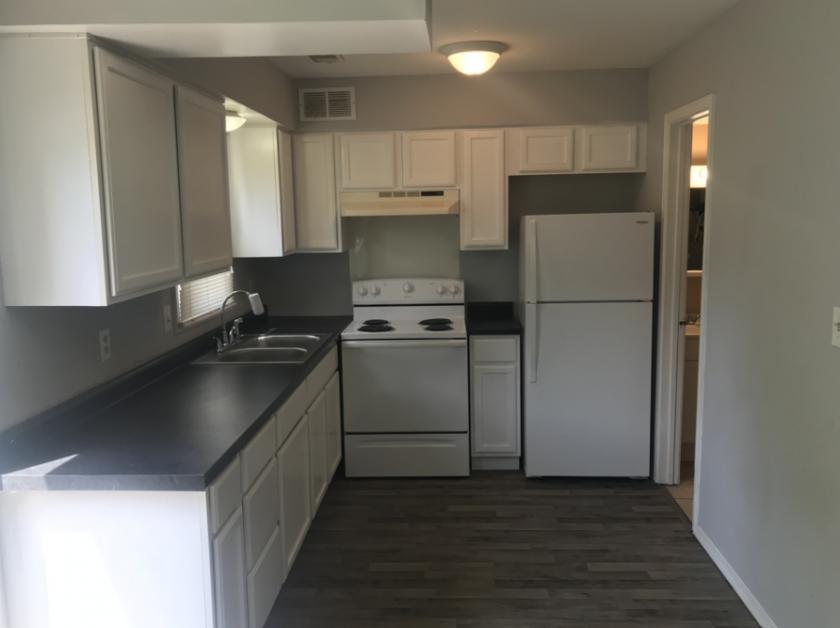
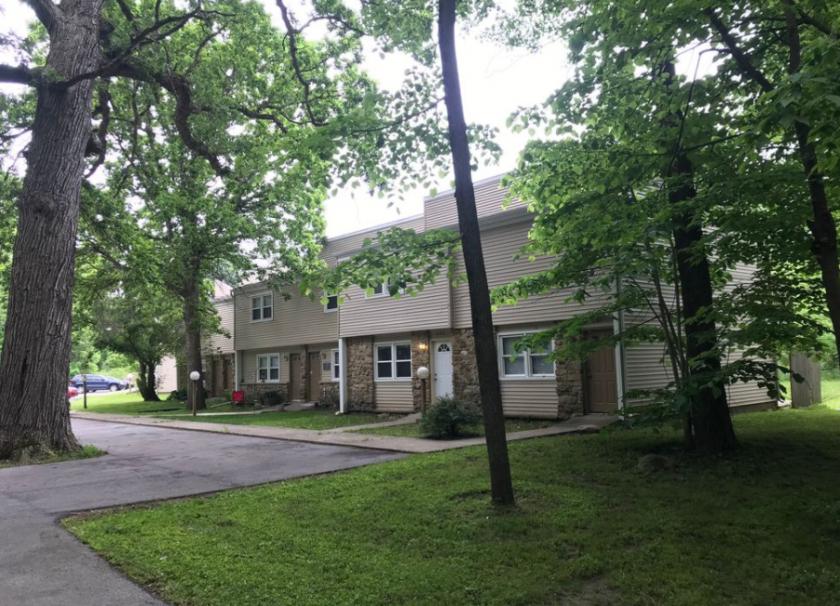
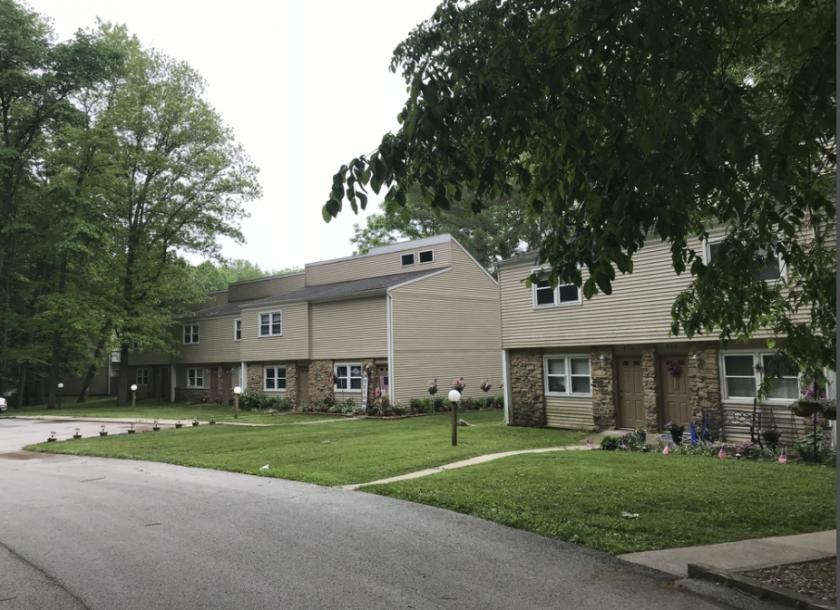
1-Mile | 3-Miles | 5-Miles | ||
---|---|---|---|---|
Total Population | 621 | 11,730 | 39,018 | |
Population Median Age | 44 | 42 | 40 | |
Population by Age | 0-9 Yrs | 83 (13%) | 1517 (12%) | 5014 (12%) |
10-19 Yrs | 64 (10%) | 1300 (11%) | 4655 (11%) | |
20-29 Yrs | 38 (6%) | 1170 (9%) | 5073 (13%) | |
30-39 Yrs | 38 (6%) | 1327 (11%) | 4294 (11%) | |
40-49 Yrs | 123 (19%) | 1460 (12%) | 4521 (11%) | |
50-59 Yrs | 40 (6%) | 1613 (13%) | 5550 (14%) | |
60-69 Yrs | 157 (25%) | 1706 (14%) | 4738 (12%) | |
70+ Yrs | 77 (12%) | 1638 (13%) | 5172 (13%) | |
Median HH Income | $85,837 | $55,919 | $48,337 | |
Total Household Income | < 24K | 11 (4%) | 961 (19%) | 4582 (26%) |
25-49K | 26 (11%) | 1234 (24%) | 4222 (24%) | |
50-74K | 43 (18%) | 1021 (20%) | 3306 (19%) | |
75-99K | 85 (36%) | 841 (16%) | 2113 (12%) | |
100-199K | 49 (20%) | 870 (17%) | 2576 (15%) | |
200K+ | 20 (8%) | 96 (1%) | 292 (1%) | |
Highest Education Level | No Diploma | 25 | 751 | 2755 |
Diploma or GED | 141 | 2903 | 10128 | |
Some College | 48 | 2065 | 6428 | |
Assoc. Degree | 81 | 789 | 2169 | |
Bachelors Degree | 107 | 1245 | 3458 | |
Higher Degree | 55 | 666 | 1901 | |
Total Housing Units | 236 | 5,513 | 19,793 | |
--Owner-Occupied | 233 | 3,473 | 11,058 | |
--Renter-Occupied | 0 | 1,551 | 6,033 | |
Owner-Occupied Values | < 100K | 21 | 1227 | 5592 |
100-199K | 123 | 1811 | 4294 | |
200-299K | 78 | 396 | 879 | |
300-399K | 12 | 26 | 159 | |
400-499K | 0 | 11 | 62 | |
500K+ | 0 | 1 | 71 | |
Total Working Age Population | 499 | 9,390 | 31,341 | |
In Work Force | 310 | 5,470 | 18,492 | |
Not In Work Force | 189 | 3,921 | 12,849 | |
Workforce Employed | 303 | 5,153 | 17,350 | |
Workforce Unemployed | 4 | 300 | 1,088 | |
Civlian Workforce | 307 | 5,453 | 18,438 | |
Military Workforce | 3 | 17 | 55 | |
Total Households | 234 | 5,024 | 17,090 | |
Family Households | 205 | 3,433 | 10,688 | |
Non-Family Households | 29 | 1,591 | 6,402 | |
Married Couple | 199 | 2,638 | 7,232 | |
Other Family | 6 | 795 | 3,456 | |
Married w/Child | 53 | 792 | 2,196 | |
Single Male w/Child | 0 | 63 | 347 | |
Single Female w/Child | 4 | 301 | 1,489 |
Population Change Last Two Decades - Plus Projection
2000 | % | 2010 | % | 2020 | % | 2030 | |
---|---|---|---|---|---|---|---|
Indiana | 6,080,485 | +7 | 6,483,802 | +4 | 6,738,573 | +4 | 7,014,880 |
Howard County | 84,964 | -3 | 82,752 | 0 | 82,388 | -2 | 80,786 |
Tipton County | 16,577 | -4 | 15,936 | -7 | 14,769 | -5 | 14,080 |
Total Working Age Population:
Total Households:
Total Working Age Population:
Total Households:
Total Working Age Population:
Total Households: