Industrial Properties
3371 West Cleveland Road South Bend, IN 46628
3371 West Cleveland Road South Bend, IN 46628
Details & Description
Property Highlights
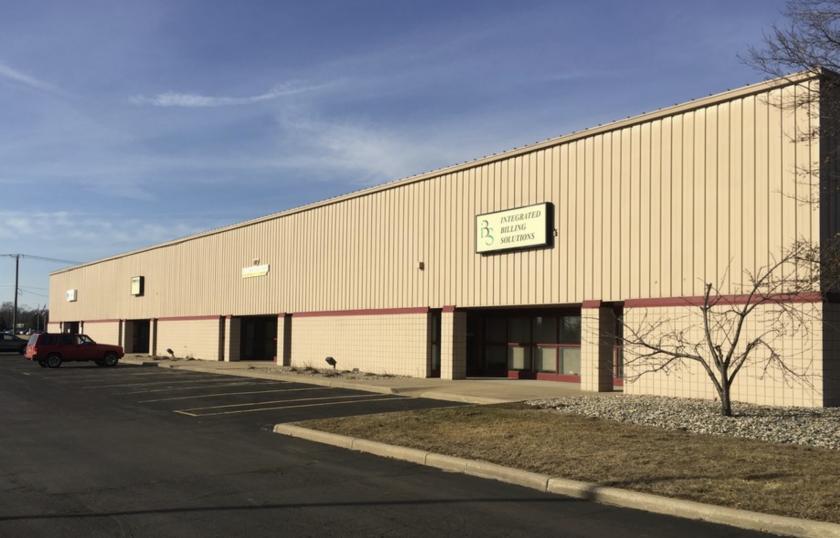
• Highly visible location along heavily traveled Cleveland Rd. with Toll Road visibility
• Site is serviced by the Metronet and provides high speed fiberoptic connectivity
Listing Agents

Jeremy McClements
O: 574-970-9004
M: 574-876-9535
jmcclements@bradleyco.com
O: 574-970-9004
M: 574-876-9535
jmcclements@bradleyco.com
While we strive to provide the most accurate information, all listing information, and demographic data, is provided by third-parties. As such, MyEListing will not be responsible for the accuracy of the information. It is strongly recommended that you verify all information with the listing agent, and any relevant agencies, prior to making any decisions.