Commercial Land
910 Morthland Drive Valparaiso, IN 46383
910 Morthland Drive Valparaiso, IN 46383
Details & Description
Property Highlights
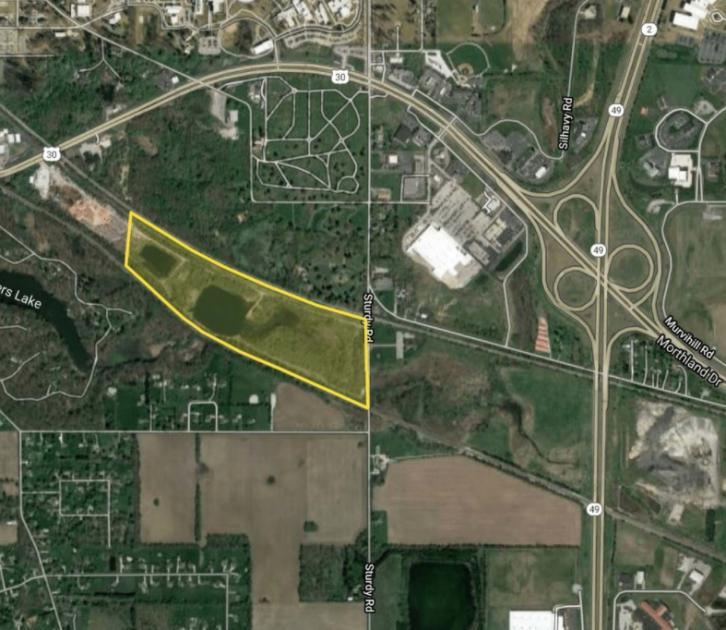
- • 59 acres available
- • Light Industrial Zoning
- • Located near US 30, a major east-west route
- • Access to municipal water and sewer
Listing Agents

Todd Dickard
O: 219-650-6500
M: 219-608-4773
tdickard@bradleyco.com
O: 219-650-6500
M: 219-608-4773
tdickard@bradleyco.com
While we strive to provide the most accurate information, all listing information, and demographic data, is provided by third-parties. As such, MyEListing will not be responsible for the accuracy of the information. It is strongly recommended that you verify all information with the listing agent, and any relevant agencies, prior to making any decisions.
