Commercial Land
2002-2040 81st Ave Merrillville, IN 46410
2002-2040 81st Ave Merrillville, IN 46410
Details & Description
Property Highlights
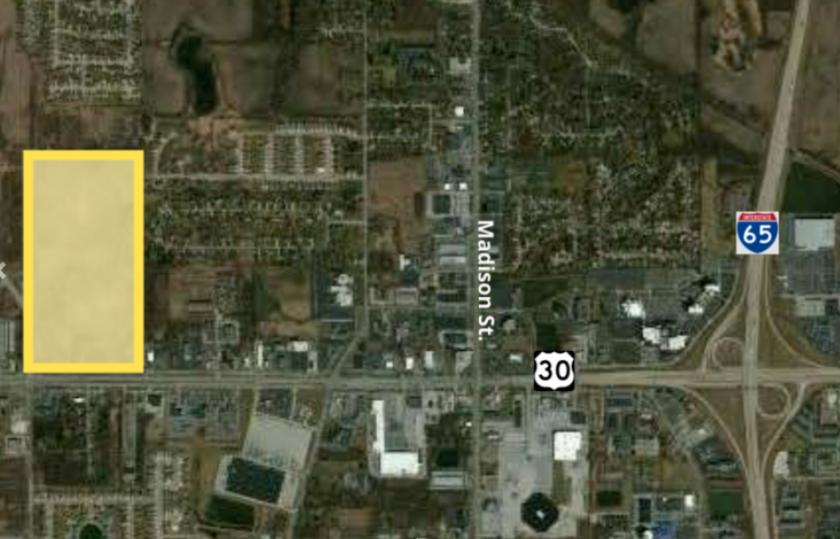
- • - 79.3 Acres
- • Taxes $2,759.88 2016
- • Zoned commercial with possible residential parcels
Listing Agents

Todd Dickard
O: 219-650-6500
M: 219-608-4773
tdickard@bradleyco.com
O: 219-650-6500
M: 219-608-4773
tdickard@bradleyco.com
While we strive to provide the most accurate information, all listing information, and demographic data, is provided by third-parties. As such, MyEListing will not be responsible for the accuracy of the information. It is strongly recommended that you verify all information with the listing agent, and any relevant agencies, prior to making any decisions.
