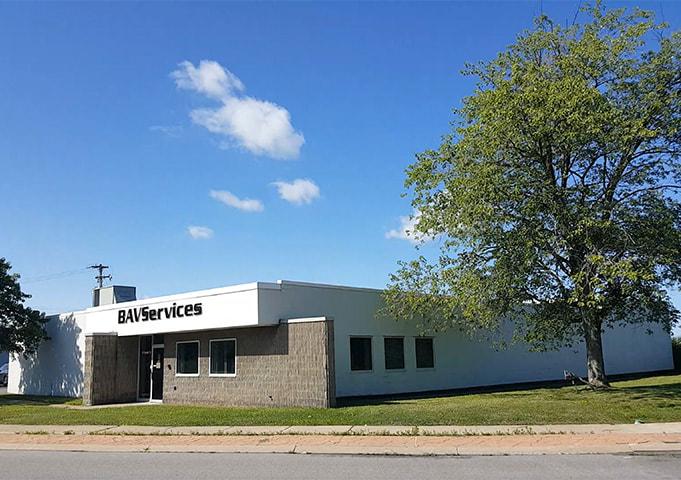
Flex-Office-Warehouse
10 Sonwil Drive Buffalo, NY 14225
10 Sonwil Drive Buffalo, NY 14225
Details & Description
Property Highlights
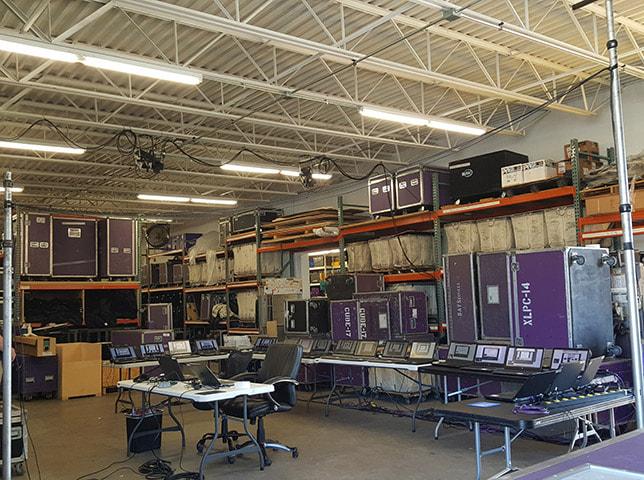
- • Steel frame concrete block construction
- • 200 amp 277480 volt 3 phase power service
- • 20 striped parking spaces .61 acres zoned M1
Listing Agents

Edward N. Mills
O: 716-856-2872
ed@militello.com
O: 716-856-2872
ed@militello.com
While we strive to provide the most accurate information, all listing information, and demographic data, is provided by third-parties. As such, MyEListing will not be responsible for the accuracy of the information. It is strongly recommended that you verify all information with the listing agent, and any relevant agencies, prior to making any decisions.