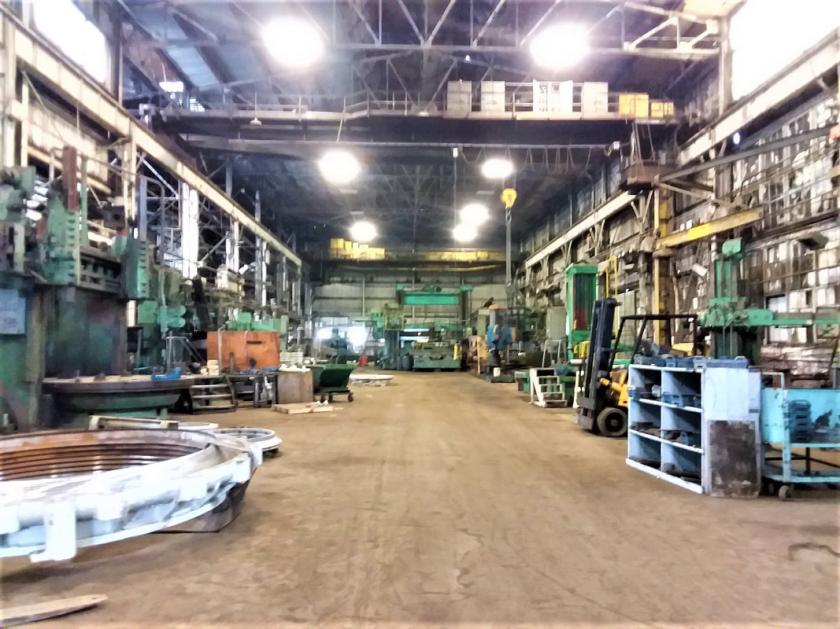
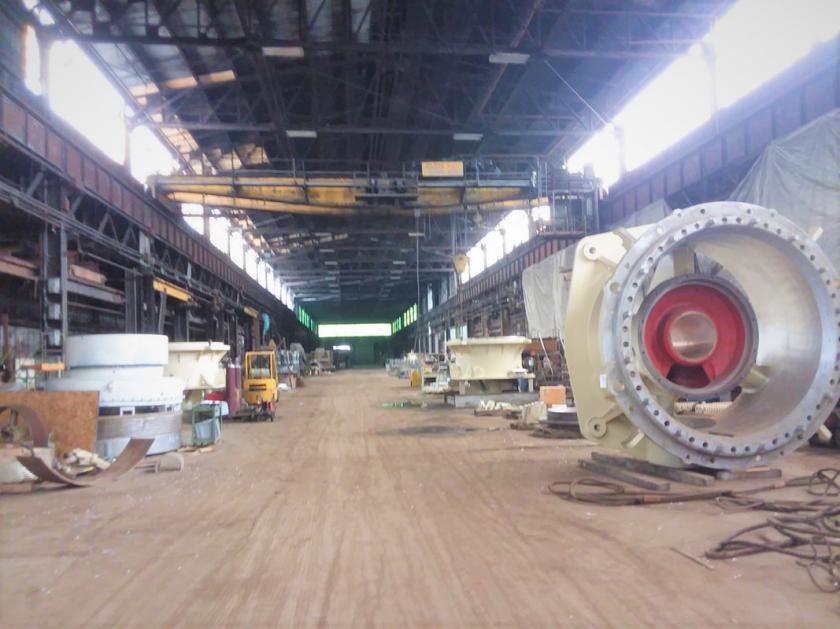
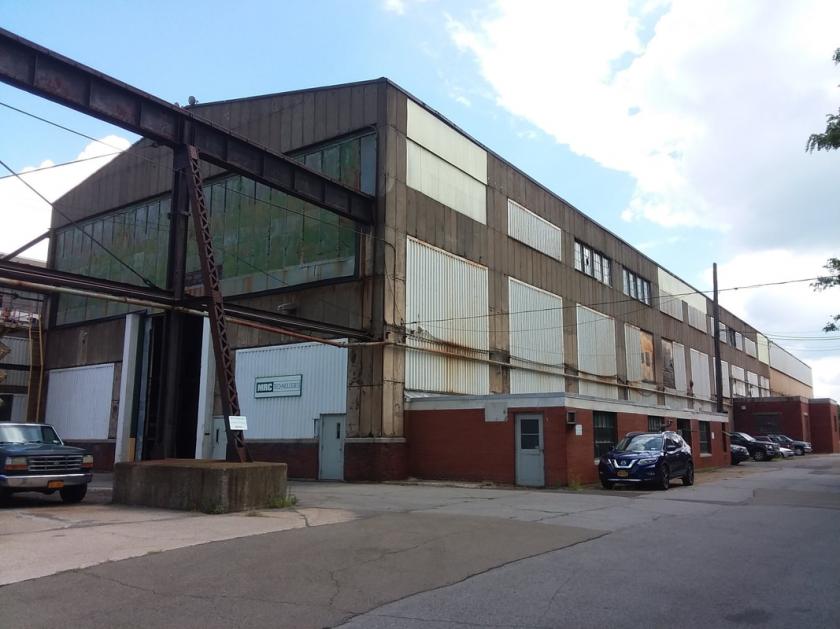
1-Mile | 3-Miles | 5-Miles | ||
---|---|---|---|---|
Total Population | 12,013 | 106,334 | 280,241 | |
Population Median Age | 40 | 39 | 39 | |
Population by Age | 0-9 Yrs | 1207 (10%) | 13094 (12%) | 33395 (11%) |
10-19 Yrs | 1230 (10%) | 12221 (11%) | 32912 (11%) | |
20-29 Yrs | 1799 (14%) | 15652 (14%) | 46535 (16%) | |
30-39 Yrs | 1886 (15%) | 14593 (13%) | 38010 (13%) | |
40-49 Yrs | 1317 (10%) | 11739 (11%) | 30086 (10%) | |
50-59 Yrs | 2018 (16%) | 15697 (14%) | 38244 (13%) | |
60-69 Yrs | 1323 (11%) | 12688 (11%) | 31482 (11%) | |
70+ Yrs | 1233 (10%) | 10649 (10%) | 29578 (10%) | |
Median HH Income | $40,736 | $40,573 | $41,392 | |
Total Household Income | < 24K | 1605 (29%) | 15371 (32%) | 39445 (31%) |
25-49K | 1690 (30%) | 11885 (25%) | 31755 (25%) | |
50-74K | 986 (17%) | 8168 (17%) | 21125 (17%) | |
75-99K | 689 (12%) | 5353 (11%) | 13394 (10%) | |
100-199K | 494 (9%) | 5445 (11%) | 15850 (12%) | |
200K+ | 16 (0%) | 540 (1%) | 2573 (2%) | |
Highest Education Level | No Diploma | 1281 | 10695 | 25873 |
Diploma or GED | 3554 | 25712 | 60772 | |
Some College | 1523 | 15179 | 38299 | |
Assoc. Degree | 1030 | 8796 | 21794 | |
Bachelors Degree | 1041 | 9177 | 28043 | |
Higher Degree | 450 | 4606 | 18284 | |
Total Housing Units | 6,468 | 55,416 | 144,002 | |
--Owner-Occupied | 3,053 | 25,163 | 61,114 | |
--Renter-Occupied | 2,429 | 21,600 | 63,027 | |
Owner-Occupied Values | < 100K | 2504 | 15045 | 29804 |
100-199K | 412 | 8543 | 22512 | |
200-299K | 11 | 756 | 4204 | |
300-399K | 22 | 222 | 1809 | |
400-499K | 9 | 77 | 958 | |
500K+ | 95 | 519 | 1826 | |
Total Working Age Population | 10,138 | 85,599 | 227,475 | |
In Work Force | 6,304 | 52,541 | 139,067 | |
Not In Work Force | 3,833 | 33,058 | 88,408 | |
Workforce Employed | 5,862 | 48,699 | 129,904 | |
Workforce Unemployed | 427 | 3,813 | 9,042 | |
Civlian Workforce | 6,289 | 52,512 | 138,946 | |
Military Workforce | 15 | 30 | 120 | |
Total Households | 5,481 | 46,762 | 124,141 | |
Family Households | 2,846 | 25,570 | 65,235 | |
Non-Family Households | 2,635 | 21,192 | 58,906 | |
Married Couple | 1,715 | 14,011 | 35,436 | |
Other Family | 1,131 | 11,559 | 29,799 | |
Married w/Child | 560 | 4,947 | 12,643 | |
Single Male w/Child | 142 | 1,123 | 2,772 | |
Single Female w/Child | 363 | 4,838 | 12,974 |
Population Change Last Two Decades - Plus Projection
2000 | % | 2010 | % | 2020 | % | 2030 | |
---|---|---|---|---|---|---|---|
New York | 18,976,457 | +2 | 19,378,102 | +4 | 20,146,131 | +2 | 20,604,030 |
Erie County | 950,265 | -3 | 919,040 | +2 | 936,084 | +1 | 949,073 |
Total Working Age Population:
Total Households:
Total Working Age Population:
Total Households:
Total Working Age Population:
Total Households: