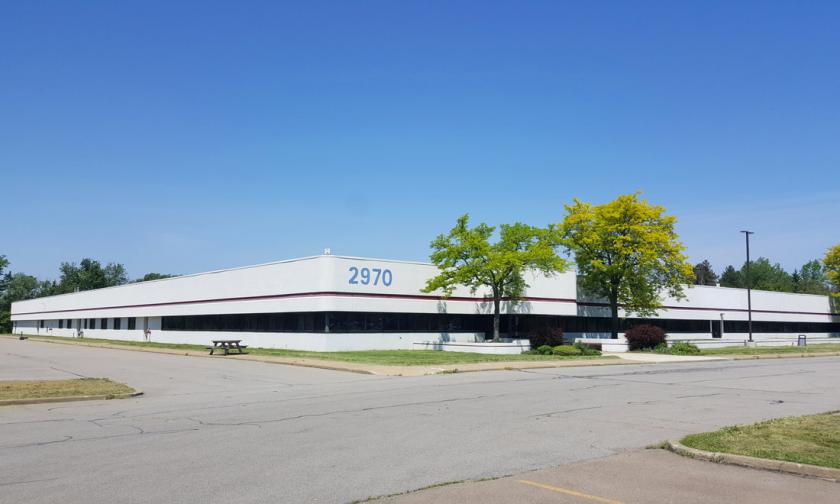
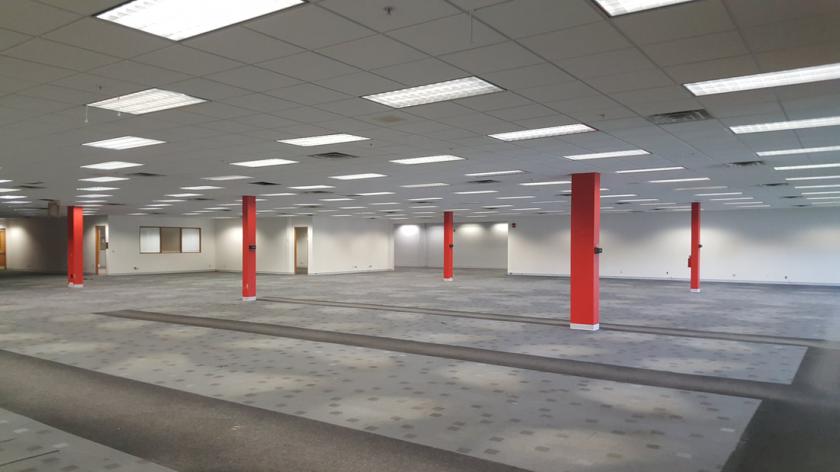
1-Mile | 3-Miles | 5-Miles | ||
---|---|---|---|---|
Total Population | 2,720 | 46,999 | 119,729 | |
Population Median Age | 42 | 44 | 43 | |
Population by Age | 0-9 Yrs | 279 (10%) | 4475 (9%) | 11292 (9%) |
10-19 Yrs | 331 (12%) | 4847 (10%) | 12565 (10%) | |
20-29 Yrs | 321 (11%) | 5598 (11%) | 14230 (11%) | |
30-39 Yrs | 374 (13%) | 5521 (11%) | 14252 (11%) | |
40-49 Yrs | 189 (6%) | 5478 (11%) | 14290 (11%) | |
50-59 Yrs | 459 (16%) | 7154 (15%) | 18705 (15%) | |
60-69 Yrs | 389 (14%) | 6751 (14%) | 16324 (13%) | |
70+ Yrs | 379 (13%) | 7173 (15%) | 18071 (15%) | |
Median HH Income | $86,914 | $69,367 | $64,977 | |
Total Household Income | < 24K | 168 (15%) | 2934 (14%) | 8150 (15%) |
25-49K | 185 (17%) | 4139 (20%) | 11708 (22%) | |
50-74K | 129 (11%) | 3875 (19%) | 10342 (19%) | |
75-99K | 126 (11%) | 3249 (16%) | 7954 (15%) | |
100-199K | 354 (32%) | 5022 (24%) | 12097 (23%) | |
200K+ | 123 (11%) | 1069 (5%) | 2314 (4%) | |
Highest Education Level | No Diploma | 73 | 1772 | 4747 |
Diploma or GED | 416 | 11036 | 29001 | |
Some College | 369 | 6496 | 16915 | |
Assoc. Degree | 365 | 5018 | 12718 | |
Bachelors Degree | 467 | 6558 | 16053 | |
Higher Degree | 239 | 4264 | 10077 | |
Total Housing Units | 1,115 | 20,974 | 55,271 | |
--Owner-Occupied | 871 | 15,043 | 38,249 | |
--Renter-Occupied | 214 | 5,245 | 14,316 | |
Owner-Occupied Values | < 100K | 64 | 1175 | 5446 |
100-199K | 382 | 9255 | 22877 | |
200-299K | 243 | 3121 | 6472 | |
300-399K | 118 | 990 | 2117 | |
400-499K | 23 | 162 | 536 | |
500K+ | 41 | 340 | 800 | |
Total Working Age Population | 2,244 | 39,661 | 101,075 | |
In Work Force | 1,421 | 25,333 | 65,599 | |
Not In Work Force | 823 | 14,327 | 35,477 | |
Workforce Employed | 1,387 | 24,743 | 63,642 | |
Workforce Unemployed | 23 | 567 | 1,905 | |
Civlian Workforce | 1,409 | 25,310 | 65,548 | |
Military Workforce | 12 | 24 | 51 | |
Total Households | 1,085 | 20,288 | 52,565 | |
Family Households | 705 | 12,804 | 31,885 | |
Non-Family Households | 381 | 7,484 | 20,680 | |
Married Couple | 608 | 10,377 | 24,792 | |
Other Family | 97 | 2,427 | 7,093 | |
Married w/Child | 275 | 3,512 | 8,215 | |
Single Male w/Child | 7 | 248 | 851 | |
Single Female w/Child | 33 | 874 | 2,367 |
Population Change Last Two Decades - Plus Projection
2000 | % | 2010 | % | 2020 | % | 2030 | |
---|---|---|---|---|---|---|---|
New York | 18,976,457 | +2 | 19,378,102 | +4 | 20,146,131 | +2 | 20,604,030 |
Erie County | 950,265 | -3 | 919,040 | +2 | 936,084 | +1 | 949,073 |
Total Working Age Population:
Total Households:
Total Working Age Population:
Total Households:
Total Working Age Population:
Total Households: