Office Space
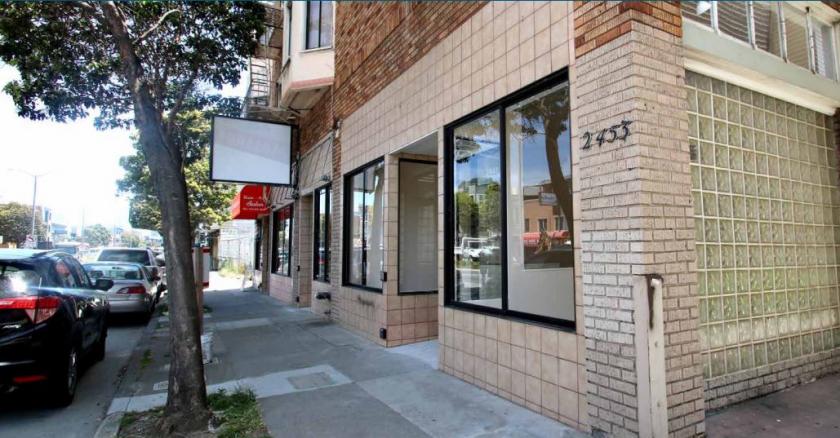
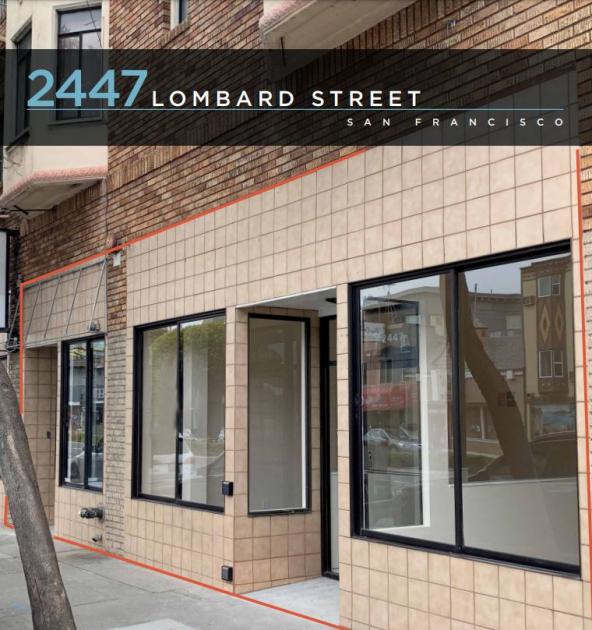
2447 Lombard Street San Francisco, CA 94123
2447 Lombard Street San Francisco, CA 94123
Details & Description
Property Highlights
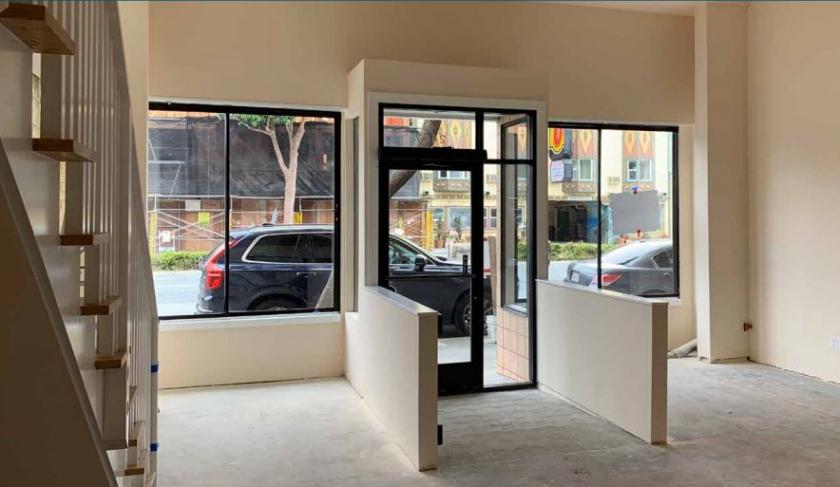
- • Window Lined Storefront
- • High Visibility
- • High Ceilings
- • Recent Renovations
- • Supportive Landlord
- • Close to public transportation
Listing Agents

Joan Ruyle
O: 415-404-7313
M: 415-471-8504
joan@mavenproperties.com
O: 415-404-7313
M: 415-471-8504
joan@mavenproperties.com
While we strive to provide the most accurate information, all listing information, and demographic data, is provided by third-parties. As such, MyEListing will not be responsible for the accuracy of the information. It is strongly recommended that you verify all information with the listing agent, and any relevant agencies, prior to making any decisions.