Retail Space
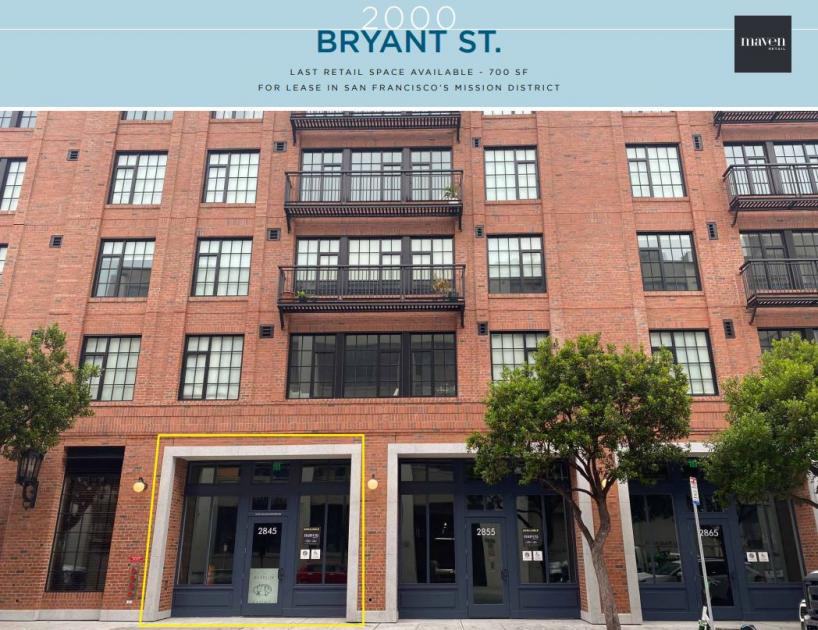
2000 Bryant Street San Francisco, CA 94110
2000 Bryant Street San Francisco, CA 94110
Details & Description
Property Highlights
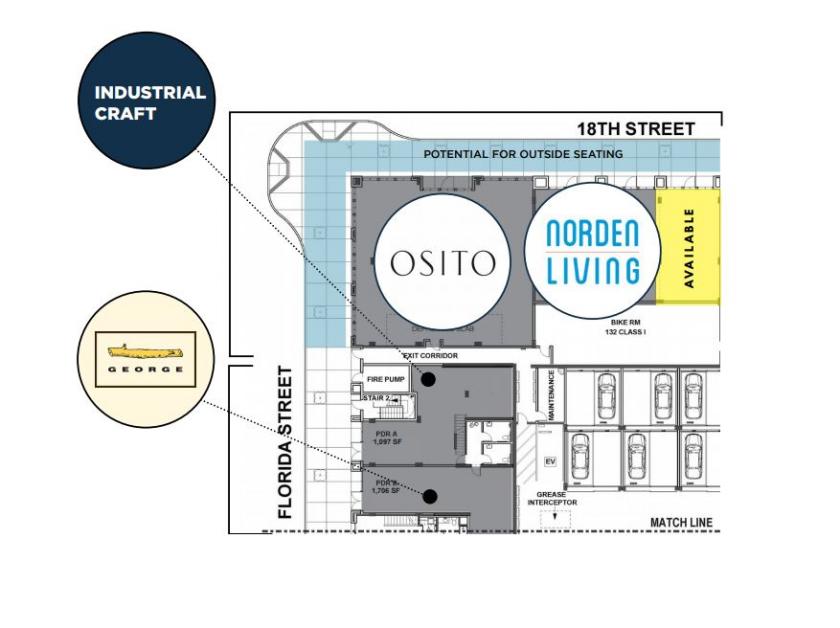
- • Expansive 18th Street and Florida Street frontage
- • Corner signage opportunity
- • Outdoor seating area permitted
- • Ventable for food and beverage Uses
- • Utilities delivered to the space
Listing Agents

Sarah BrettSchwartz
O: 415-404-6959
M: 415-310-5313
sarah@mavenproperties.com
O: 415-404-6959
M: 415-310-5313
sarah@mavenproperties.com
While we strive to provide the most accurate information, all listing information, and demographic data, is provided by third-parties. As such, MyEListing will not be responsible for the accuracy of the information. It is strongly recommended that you verify all information with the listing agent, and any relevant agencies, prior to making any decisions.