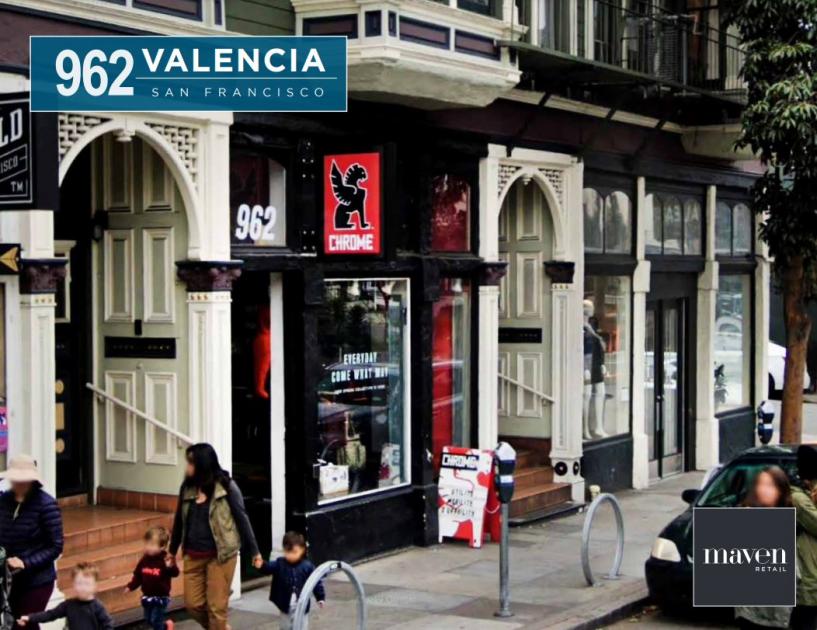
Retail Space
962 Valencia Street San Francisco, CA 94110
962 Valencia Street San Francisco, CA 94110
Details & Description
Property Highlights
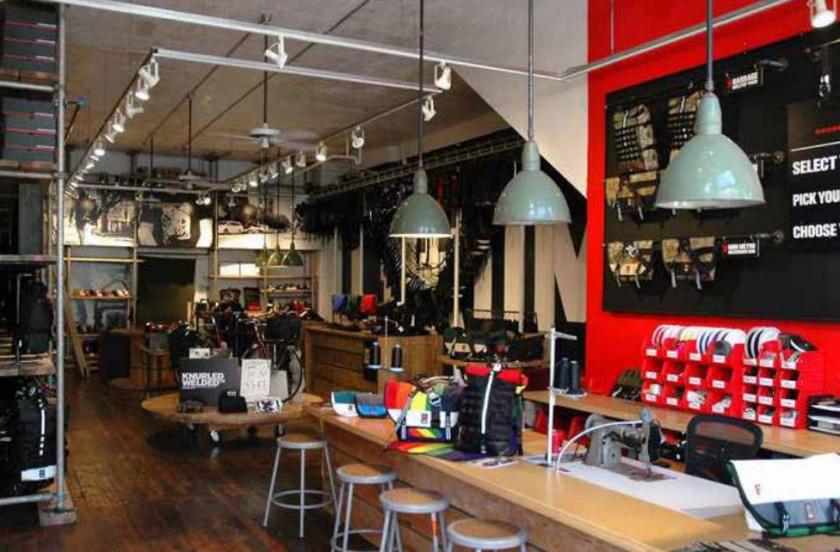
- • 1,700 SF
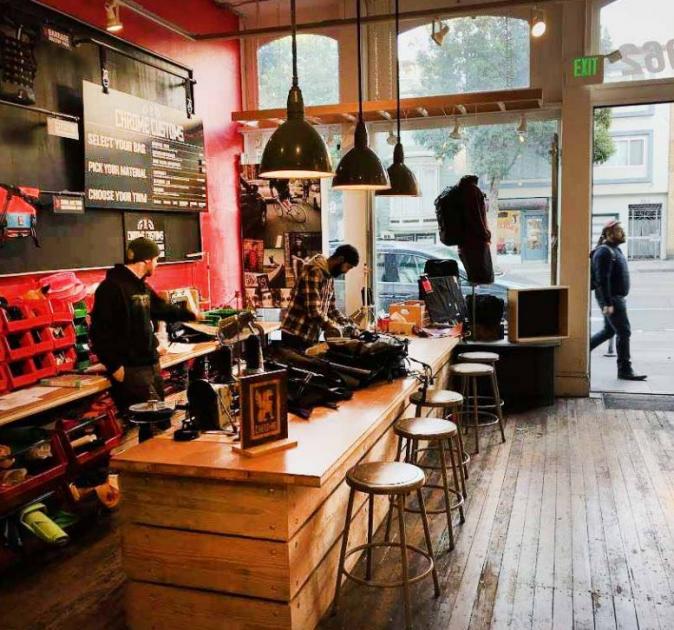
- • High ceilings with abundant sunlight
- • Open storefont large display windows
- • Hardwood floors
- • New ADA bathroom
Listing Agents

Sarah BrettSchwartz
O: 415-404-6959
M: 415-310-5313
sarah@mavenproperties.com
O: 415-404-6959
M: 415-310-5313
sarah@mavenproperties.com
While we strive to provide the most accurate information, all listing information, and demographic data, is provided by third-parties. As such, MyEListing will not be responsible for the accuracy of the information. It is strongly recommended that you verify all information with the listing agent, and any relevant agencies, prior to making any decisions.