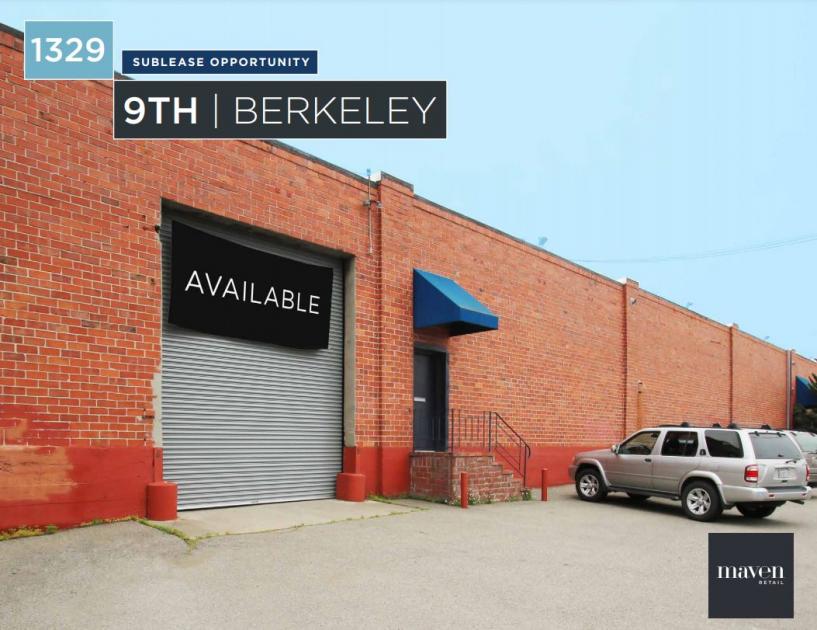
Flex-Office-Warehouse
1329 Ninth Street Berkeley, CA 94710
1329 Ninth Street Berkeley, CA 94710
Details & Description
Property Highlights
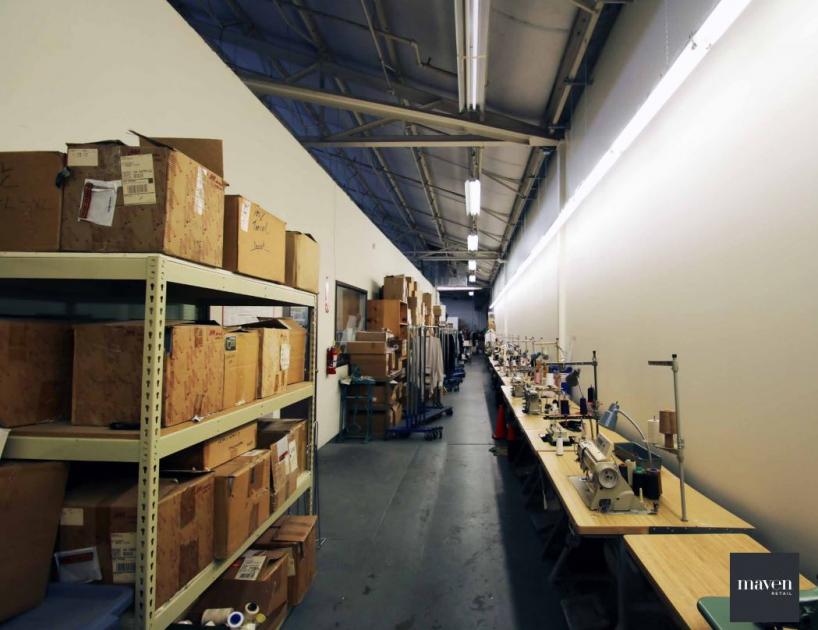
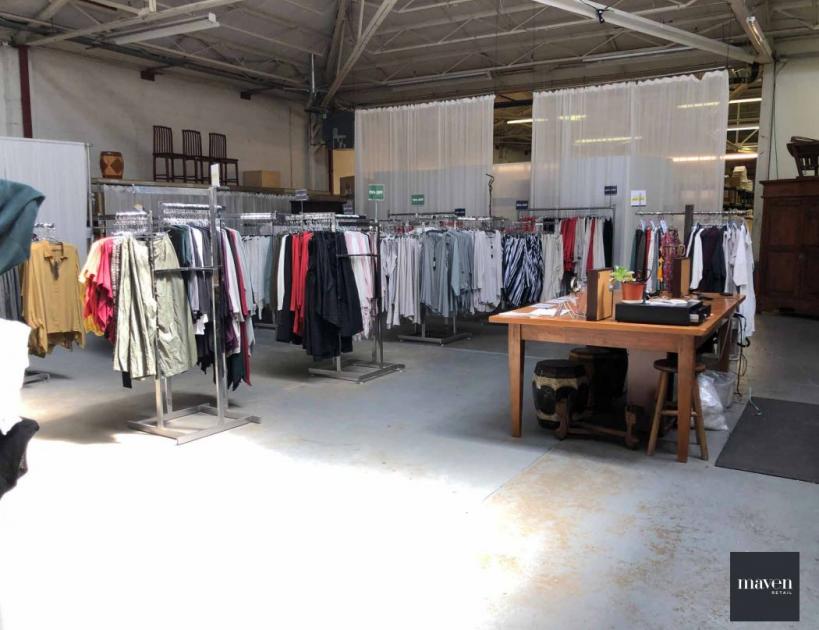
- • Approx. 7,000 sq. ft. of warehouse
- • Approx. 6,800 sq. ft. of office
- • Great ceiling heights with highest point at 22 6
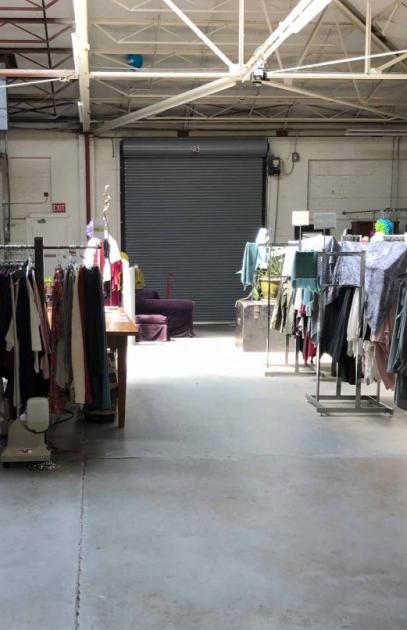
- • Drive in loading with roll-up door
- • Heavy power
- • Easy Access to Highway 58080
Additional Photos

Listing Agents

Haley Klein
O: 415-404-7330
M: 925-408-6415
haley@mavenproperties.com
O: 415-404-7330
M: 925-408-6415
haley@mavenproperties.com
While we strive to provide the most accurate information, all listing information, and demographic data, is provided by third-parties. As such, MyEListing will not be responsible for the accuracy of the information. It is strongly recommended that you verify all information with the listing agent, and any relevant agencies, prior to making any decisions.


