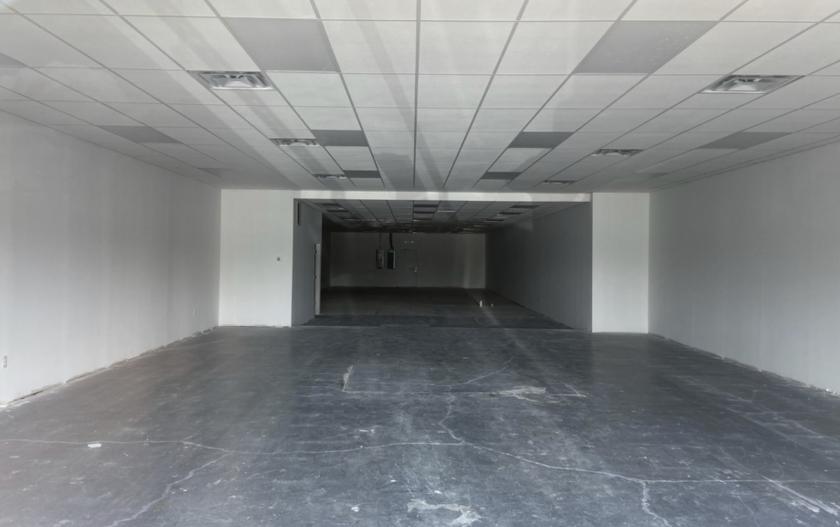
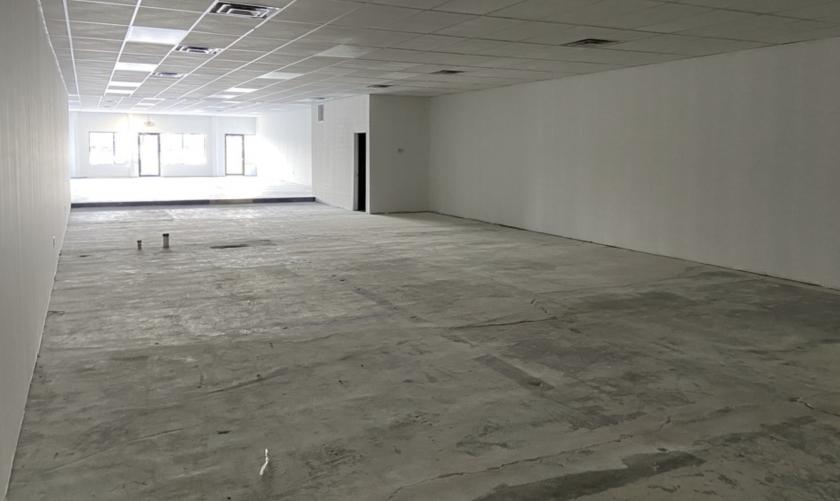
1-Mile | 3-Miles | 5-Miles | ||
---|---|---|---|---|
Total Population | 6,288 | 55,312 | 150,401 | |
Population Median Age | 37 | 36 | 36 | |
Population by Age | 0-9 Yrs | 845 (13%) | 7127 (12%) | 21515 (14%) |
10-19 Yrs | 1084 (17%) | 9144 (16%) | 22057 (14%) | |
20-29 Yrs | 692 (11%) | 6851 (12%) | 22560 (14%) | |
30-39 Yrs | 823 (13%) | 7850 (14%) | 21014 (13%) | |
40-49 Yrs | 754 (11%) | 7330 (13%) | 19584 (13%) | |
50-59 Yrs | 1007 (16%) | 7118 (12%) | 18677 (12%) | |
60-69 Yrs | 613 (9%) | 5431 (9%) | 13869 (9%) | |
70+ Yrs | 470 (7%) | 4461 (8%) | 11125 (7%) | |
Median HH Income | $74,530 | $67,437 | $58,359 | |
Total Household Income | < 24K | 232 (10%) | 2382 (12%) | 9174 (16%) |
25-49K | 433 (20%) | 4296 (22%) | 14381 (25%) | |
50-74K | 424 (19%) | 4265 (22%) | 10663 (19%) | |
75-99K | 501 (23%) | 3581 (18%) | 8416 (15%) | |
100-199K | 521 (24%) | 4145 (21%) | 10888 (19%) | |
200K+ | 51 (2%) | 659 (3%) | 1918 (3%) | |
Highest Education Level | No Diploma | 405 | 3362 | 10074 |
Diploma or GED | 1344 | 11259 | 27808 | |
Some College | 801 | 7475 | 20748 | |
Assoc. Degree | 408 | 3510 | 9320 | |
Bachelors Degree | 683 | 6489 | 18868 | |
Higher Degree | 340 | 3408 | 9204 | |
Total Housing Units | 2,366 | 21,094 | 60,871 | |
--Owner-Occupied | 1,654 | 14,133 | 33,983 | |
--Renter-Occupied | 507 | 5,194 | 21,457 | |
Owner-Occupied Values | < 100K | 257 | 2319 | 6169 |
100-199K | 1207 | 9568 | 19249 | |
200-299K | 172 | 1837 | 6179 | |
300-399K | 15 | 284 | 1560 | |
400-499K | 0 | 1 | 328 | |
500K+ | 3 | 123 | 498 | |
Total Working Age Population | 4,949 | 42,739 | 115,336 | |
In Work Force | 3,508 | 29,475 | 81,065 | |
Not In Work Force | 1,441 | 13,264 | 34,271 | |
Workforce Employed | 3,434 | 28,049 | 76,682 | |
Workforce Unemployed | 74 | 1,426 | 4,343 | |
Civlian Workforce | 3,508 | 29,475 | 81,025 | |
Military Workforce | 0 | 0 | 40 | |
Total Households | 2,162 | 19,327 | 55,439 | |
Family Households | 1,643 | 13,509 | 35,752 | |
Non-Family Households | 518 | 5,818 | 19,688 | |
Married Couple | 1,184 | 9,512 | 23,923 | |
Other Family | 459 | 3,996 | 11,829 | |
Married w/Child | 526 | 4,348 | 10,851 | |
Single Male w/Child | 86 | 530 | 1,627 | |
Single Female w/Child | 214 | 1,754 | 5,181 |
Population Change Last Two Decades - Plus Projection
2000 | % | 2010 | % | 2020 | % | 2030 | |
---|---|---|---|---|---|---|---|
Indiana | 6,080,485 | +7 | 6,483,802 | +4 | 6,738,573 | +4 | 7,014,880 |
Hendricks County | 104,093 | +40 | 145,448 | +17 | 170,323 | +16 | 197,902 |
Marion County | 860,454 | +5 | 903,393 | +7 | 963,732 | +4 | 1,001,231 |
Total Working Age Population:
Total Households:
Total Working Age Population:
Total Households:
Total Working Age Population:
Total Households: