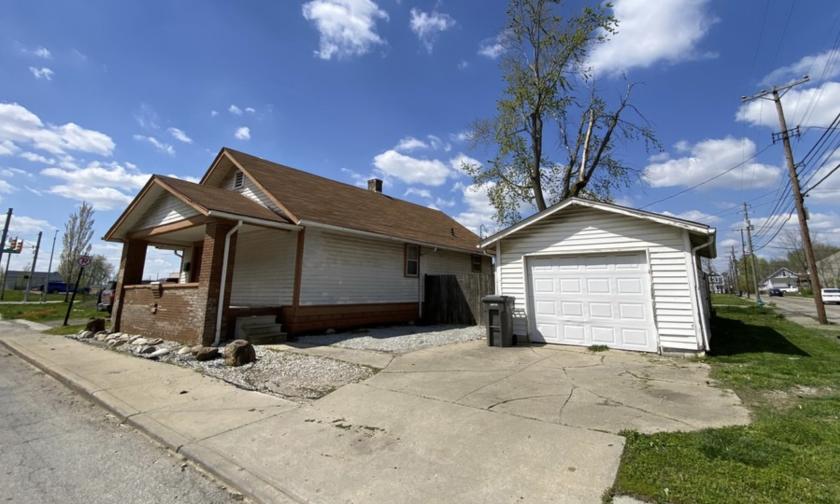
1-Mile | 3-Miles | 5-Miles | ||
---|---|---|---|---|
Total Population | 8,918 | 87,249 | 235,207 | |
Population Median Age | 37 | 36 | 36 | |
Population by Age | 0-9 Yrs | 854 (9%) | 9582 (10%) | 32836 (13%) |
10-19 Yrs | 603 (6%) | 9485 (10%) | 28057 (11%) | |
20-29 Yrs | 2293 (25%) | 20400 (23%) | 44048 (18%) | |
30-39 Yrs | 1801 (20%) | 14670 (16%) | 35862 (15%) | |
40-49 Yrs | 919 (10%) | 8883 (10%) | 25970 (11%) | |
50-59 Yrs | 954 (10%) | 11112 (12%) | 30155 (12%) | |
60-69 Yrs | 910 (10%) | 7857 (9%) | 22309 (9%) | |
70+ Yrs | 584 (6%) | 5259 (6%) | 15968 (6%) | |
Median HH Income | $44,930 | $38,031 | $37,663 | |
Total Household Income | < 24K | 1172 (31%) | 12551 (35%) | 31631 (34%) |
25-49K | 823 (21%) | 9056 (25%) | 26277 (28%) | |
50-74K | 621 (16%) | 5576 (15%) | 15665 (16%) | |
75-99K | 444 (11%) | 3160 (8%) | 8239 (8%) | |
100-199K | 573 (15%) | 4193 (11%) | 8942 (9%) | |
200K+ | 140 (3%) | 1127 (3%) | 1963 (2%) | |
Highest Education Level | No Diploma | 1336 | 13598 | 33793 |
Diploma or GED | 1752 | 17037 | 50668 | |
Some College | 861 | 8504 | 27667 | |
Assoc. Degree | 336 | 3245 | 9280 | |
Bachelors Degree | 1509 | 10689 | 22167 | |
Higher Degree | 900 | 6893 | 12350 | |
Total Housing Units | 5,334 | 45,186 | 115,175 | |
--Owner-Occupied | 1,565 | 14,133 | 42,121 | |
--Renter-Occupied | 2,207 | 21,529 | 50,596 | |
Owner-Occupied Values | < 100K | 720 | 7552 | 23839 |
100-199K | 364 | 2884 | 11862 | |
200-299K | 252 | 1533 | 3111 | |
300-399K | 126 | 1117 | 1538 | |
400-499K | 44 | 394 | 688 | |
500K+ | 60 | 654 | 1082 | |
Total Working Age Population | 7,704 | 72,238 | 185,633 | |
In Work Force | 4,691 | 44,124 | 115,559 | |
Not In Work Force | 3,012 | 28,114 | 70,074 | |
Workforce Employed | 4,380 | 41,334 | 107,000 | |
Workforce Unemployed | 311 | 2,750 | 8,438 | |
Civlian Workforce | 4,691 | 44,084 | 115,438 | |
Military Workforce | 0 | 40 | 121 | |
Total Households | 3,772 | 35,662 | 92,717 | |
Family Households | 1,463 | 14,442 | 43,952 | |
Non-Family Households | 2,309 | 21,220 | 48,765 | |
Married Couple | 929 | 8,553 | 24,721 | |
Other Family | 534 | 5,889 | 19,231 | |
Married w/Child | 187 | 2,892 | 9,243 | |
Single Male w/Child | 107 | 651 | 2,853 | |
Single Female w/Child | 151 | 2,340 | 7,658 |
Population Change Last Two Decades - Plus Projection
2000 | % | 2010 | % | 2020 | % | 2030 | |
---|---|---|---|---|---|---|---|
Indiana | 6,080,485 | +7 | 6,483,802 | +4 | 6,738,573 | +4 | 7,014,880 |
Marion County | 860,454 | +5 | 903,393 | +7 | 963,732 | +4 | 1,001,231 |
Total Working Age Population:
Total Households:
Total Working Age Population:
Total Households:
Total Working Age Population:
Total Households: