Industrial Properties
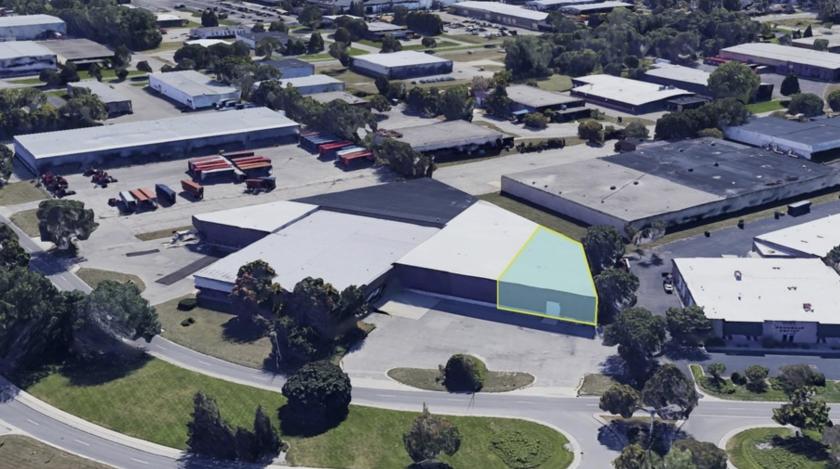
3457 Roger B Chaffee Memorial Boulevard Southeast Grand Rapids, MI 49548
3457 Roger B Chaffee Memorial Boulevard Southeast Grand Rapids, MI 49548
Details & Description
Property Highlights
- • 18 clear height
- • Owner will sell racking equipment
- • Ample surface level parking
- • 1 dock and 1 large overhead door
Listing Agents

Kyle Grooters
O: 616-254-0005
M: 951-733-3833
kgrooters@bradleyco.com
O: 616-254-0005
M: 951-733-3833
kgrooters@bradleyco.com

Vee Kimbrell
Bradley Company
O: 574-213-5585
vkimbrell@bradleyco.com
Bradley Company
O: 574-213-5585
vkimbrell@bradleyco.com
While we strive to provide the most accurate information, all listing information, and demographic data, is provided by third-parties. As such, MyEListing will not be responsible for the accuracy of the information. It is strongly recommended that you verify all information with the listing agent, and any relevant agencies, prior to making any decisions.


