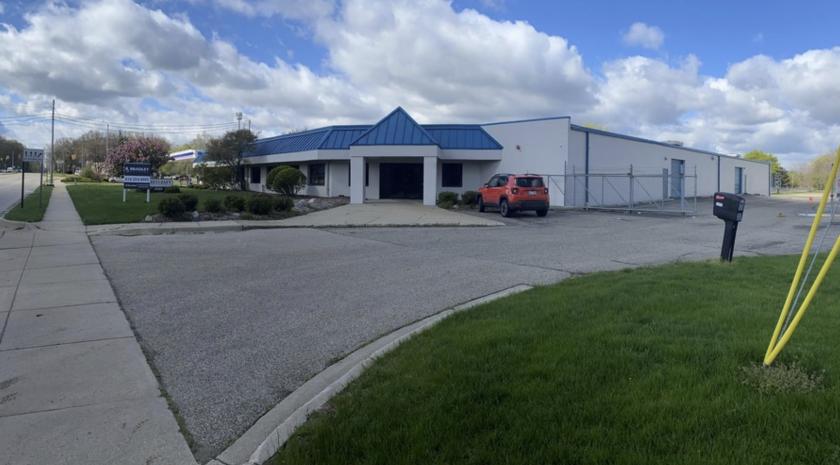
Industrial Properties
4329 Eastern Avenue Southeast Kentwood, MI 49508
4329 Eastern Avenue Southeast Kentwood, MI 49508
Details & Description
Property Highlights
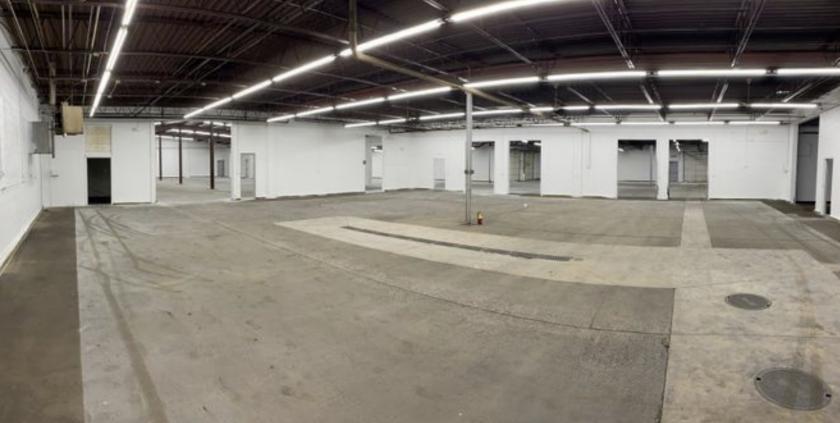
- • Access to 2 trucks docks
- • 14 ceilings 12 clear height
- • Fully-fenced in with two access gates
- • 1,100 amps
Listing Agents

Kyle Grooters
O: 616-254-0005
M: 951-733-3833
kgrooters@bradleyco.com
O: 616-254-0005
M: 951-733-3833
kgrooters@bradleyco.com

Vee Kimbrell
Bradley Company
O: 574-213-5585
vkimbrell@bradleyco.com
Bradley Company
O: 574-213-5585
vkimbrell@bradleyco.com
While we strive to provide the most accurate information, all listing information, and demographic data, is provided by third-parties. As such, MyEListing will not be responsible for the accuracy of the information. It is strongly recommended that you verify all information with the listing agent, and any relevant agencies, prior to making any decisions.