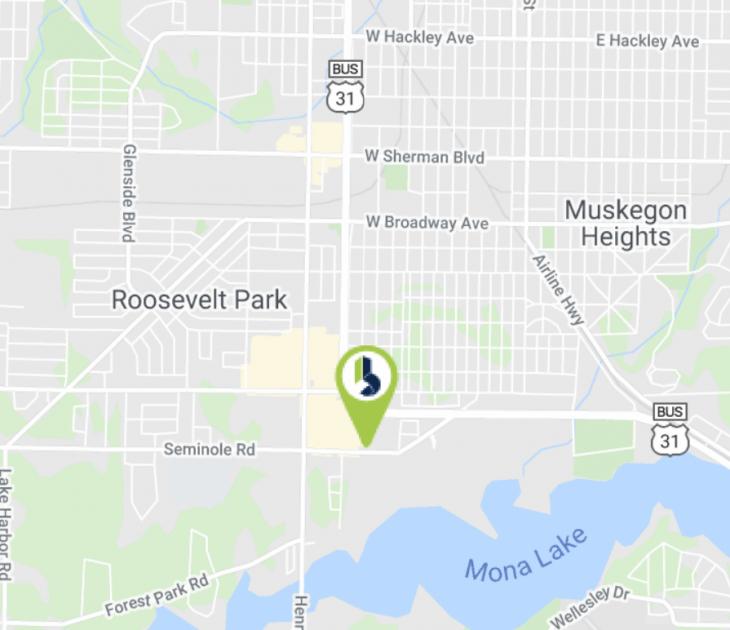
1-Mile | 3-Miles | 5-Miles | ||
---|---|---|---|---|
Total Population | 8,228 | 54,693 | 107,069 | |
Population Median Age | 39 | 39 | 40 | |
Population by Age | 0-9 Yrs | 1019 (12%) | 7273 (13%) | 12637 (11%) |
10-19 Yrs | 997 (12%) | 7055 (12%) | 13744 (12%) | |
20-29 Yrs | 1370 (16%) | 7414 (13%) | 14603 (13%) | |
30-39 Yrs | 909 (11%) | 7076 (12%) | 13178 (12%) | |
40-49 Yrs | 904 (10%) | 6020 (11%) | 11910 (11%) | |
50-59 Yrs | 1078 (13%) | 7163 (13%) | 14670 (13%) | |
60-69 Yrs | 1023 (12%) | 6779 (12%) | 13998 (13%) | |
70+ Yrs | 929 (11%) | 5910 (10%) | 12329 (11%) | |
Median HH Income | $44,618 | $43,617 | $45,630 | |
Total Household Income | < 24K | 842 (24%) | 5664 (25%) | 10924 (25%) |
25-49K | 1006 (28%) | 6772 (30%) | 11659 (27%) | |
50-74K | 789 (22%) | 4088 (18%) | 7554 (17%) | |
75-99K | 346 (9%) | 2245 (10%) | 4593 (10%) | |
100-199K | 410 (11%) | 2773 (12%) | 6048 (14%) | |
200K+ | 88 (2%) | 626 (2%) | 1407 (3%) | |
Highest Education Level | No Diploma | 655 | 3599 | 7271 |
Diploma or GED | 1747 | 11121 | 22067 | |
Some College | 1283 | 9423 | 17990 | |
Assoc. Degree | 542 | 4443 | 8636 | |
Bachelors Degree | 855 | 5635 | 11585 | |
Higher Degree | 461 | 2548 | 6109 | |
Total Housing Units | 3,952 | 25,072 | 48,398 | |
--Owner-Occupied | 1,946 | 14,557 | 28,461 | |
--Renter-Occupied | 1,535 | 7,612 | 13,724 | |
Owner-Occupied Values | < 100K | 1008 | 7277 | 12238 |
100-199K | 589 | 4831 | 9763 | |
200-299K | 181 | 1549 | 3796 | |
300-399K | 62 | 488 | 1494 | |
400-499K | 61 | 160 | 470 | |
500K+ | 46 | 252 | 700 | |
Total Working Age Population | 6,730 | 42,842 | 86,074 | |
In Work Force | 4,227 | 26,367 | 49,451 | |
Not In Work Force | 2,503 | 16,475 | 36,623 | |
Workforce Employed | 3,870 | 24,260 | 46,016 | |
Workforce Unemployed | 345 | 2,087 | 3,398 | |
Civlian Workforce | 4,215 | 26,347 | 49,414 | |
Military Workforce | 12 | 20 | 37 | |
Total Households | 3,481 | 22,170 | 42,185 | |
Family Households | 2,046 | 13,870 | 26,031 | |
Non-Family Households | 1,434 | 8,299 | 16,154 | |
Married Couple | 1,210 | 8,351 | 16,821 | |
Other Family | 836 | 5,519 | 9,210 | |
Married w/Child | 414 | 2,766 | 5,488 | |
Single Male w/Child | 150 | 760 | 1,233 | |
Single Female w/Child | 255 | 2,589 | 4,274 |
Population Change Last Two Decades - Plus Projection
2000 | % | 2010 | % | 2020 | % | 2030 | |
---|---|---|---|---|---|---|---|
Michigan | 9,938,444 | -1 | 9,883,640 | +1 | 10,023,423 | +4 | 10,424,510 |
Muskegon County | 170,200 | +1 | 172,188 | +2 | 175,323 | +4 | 182,278 |
Ottawa County | 238,314 | +11 | 263,801 | +12 | 295,791 | +12 | 331,723 |
Total Working Age Population:
Total Households:
Total Working Age Population:
Total Households:
Total Working Age Population:
Total Households: