Office Space
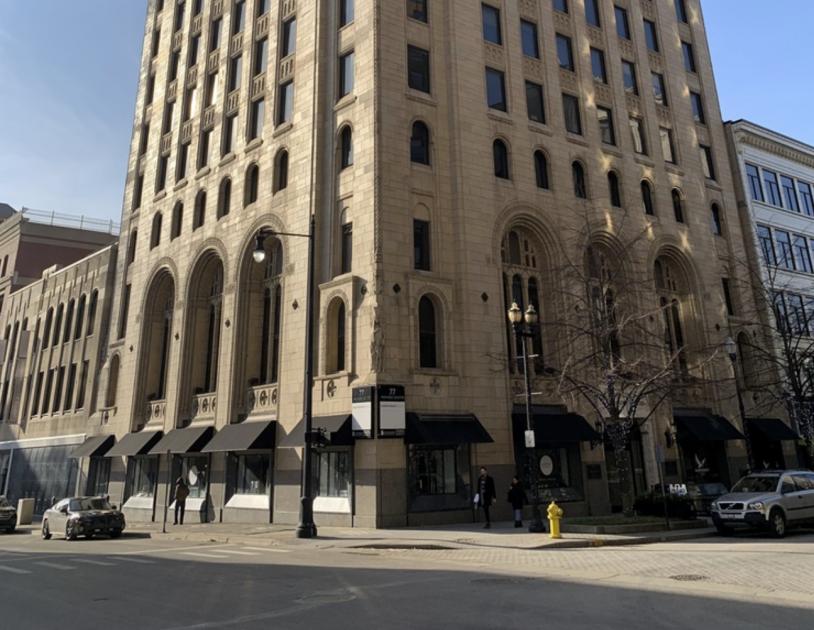
77 Monroe Center Street Northwest Grand Rapids, MI 49503
77 Monroe Center Street Northwest Grand Rapids, MI 49503
Details & Description
Property Highlights
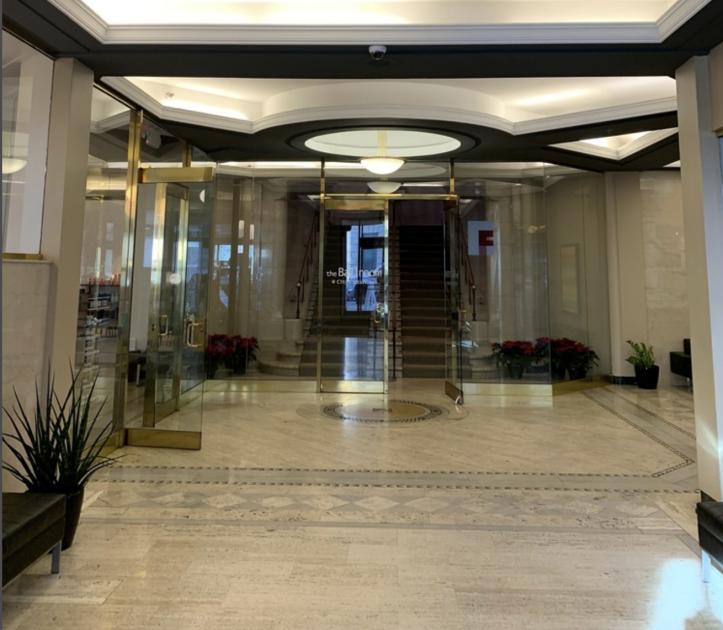
• Newly renovated lobby with original travertine floors
• Low-cost parking ramp options available
Listing Agents

Jeff Tucker
O: 616-254-0014
M: 616-881-9321
jtucker@bradleyco.com
O: 616-254-0014
M: 616-881-9321
jtucker@bradleyco.com

Vee Kimbrell
Bradley Company
O: 574-213-5585
vkimbrell@bradleyco.com
Bradley Company
O: 574-213-5585
vkimbrell@bradleyco.com
While we strive to provide the most accurate information, all listing information, and demographic data, is provided by third-parties. As such, MyEListing will not be responsible for the accuracy of the information. It is strongly recommended that you verify all information with the listing agent, and any relevant agencies, prior to making any decisions.