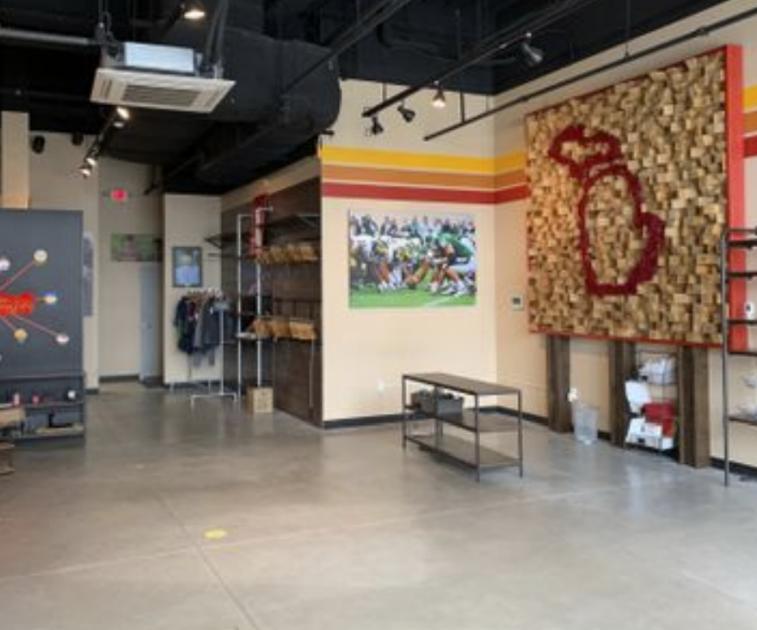
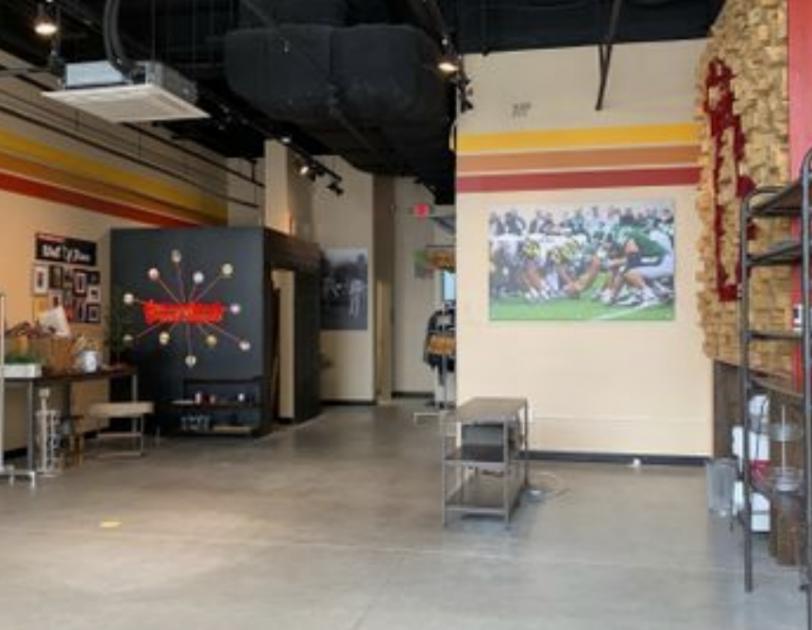
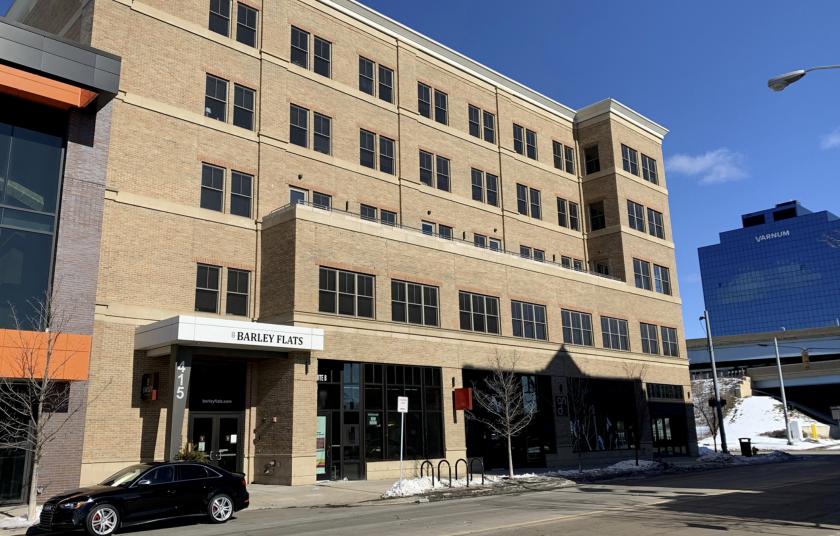
1-Mile | 3-Miles | 5-Miles | ||
---|---|---|---|---|
Total Population | 19,018 | 128,923 | 255,053 | |
Population Median Age | 32 | 34 | 35 | |
Population by Age | 0-9 Yrs | 1928 (10%) | 17046 (13%) | 34862 (13%) |
10-19 Yrs | 1954 (10%) | 16494 (12%) | 31460 (12%) | |
20-29 Yrs | 6315 (33%) | 30987 (24%) | 51005 (19%) | |
30-39 Yrs | 3305 (17%) | 20331 (15%) | 38791 (15%) | |
40-49 Yrs | 1845 (9%) | 13159 (10%) | 27314 (10%) | |
50-59 Yrs | 1845 (9%) | 13387 (10%) | 28996 (11%) | |
60-69 Yrs | 1206 (6%) | 9833 (7%) | 23049 (9%) | |
70+ Yrs | 621 (3%) | 7687 (5%) | 19576 (7%) | |
Median HH Income | $45,435 | $48,437 | $53,269 | |
Total Household Income | < 24K | 2416 (30%) | 12429 (25%) | 21366 (21%) |
25-49K | 1968 (24%) | 12426 (25%) | 24594 (25%) | |
50-74K | 1345 (17%) | 9314 (19%) | 18856 (19%) | |
75-99K | 902 (11%) | 5806 (12%) | 12621 (12%) | |
100-199K | 914 (11%) | 6782 (14%) | 15799 (16%) | |
200K+ | 361 (4%) | 1457 (3%) | 3905 (4%) | |
Highest Education Level | No Diploma | 1277 | 12051 | 21271 |
Diploma or GED | 2583 | 18314 | 38312 | |
Some College | 2478 | 16802 | 34688 | |
Assoc. Degree | 957 | 6212 | 13458 | |
Bachelors Degree | 2923 | 18971 | 38949 | |
Higher Degree | 1442 | 8357 | 18882 | |
Total Housing Units | 9,282 | 53,490 | 104,448 | |
--Owner-Occupied | 2,621 | 25,227 | 57,526 | |
--Renter-Occupied | 5,285 | 22,987 | 39,616 | |
Owner-Occupied Values | < 100K | 897 | 7867 | 13312 |
100-199K | 985 | 12758 | 29057 | |
200-299K | 334 | 2945 | 8800 | |
300-399K | 201 | 926 | 2989 | |
400-499K | 38 | 246 | 1321 | |
500K+ | 166 | 485 | 2047 | |
Total Working Age Population | 15,970 | 102,164 | 200,758 | |
In Work Force | 12,513 | 72,967 | 140,657 | |
Not In Work Force | 3,456 | 29,197 | 60,101 | |
Workforce Employed | 11,799 | 68,411 | 133,065 | |
Workforce Unemployed | 703 | 4,538 | 7,429 | |
Civlian Workforce | 12,502 | 72,949 | 140,495 | |
Military Workforce | 12 | 18 | 162 | |
Total Households | 7,906 | 48,213 | 97,142 | |
Family Households | 3,329 | 25,947 | 56,371 | |
Non-Family Households | 4,577 | 22,266 | 40,771 | |
Married Couple | 1,940 | 15,808 | 38,272 | |
Other Family | 1,389 | 10,139 | 18,099 | |
Married w/Child | 701 | 6,587 | 15,770 | |
Single Male w/Child | 200 | 1,526 | 2,745 | |
Single Female w/Child | 575 | 4,489 | 7,822 |
Population Change Last Two Decades - Plus Projection
2000 | % | 2010 | % | 2020 | % | 2030 | |
---|---|---|---|---|---|---|---|
Michigan | 9,938,444 | -1 | 9,883,640 | +1 | 10,023,423 | +4 | 10,424,510 |
Kent County | 574,335 | +5 | 602,622 | +11 | 668,535 | +12 | 746,921 |
Total Working Age Population:
Total Households:
Total Working Age Population:
Total Households:
Total Working Age Population:
Total Households: