Industrial Properties
61675 Michigan 40 Paw Paw, MI 49079
61675 Michigan 40 Paw Paw, MI 49079
Details & Description
Property Highlights
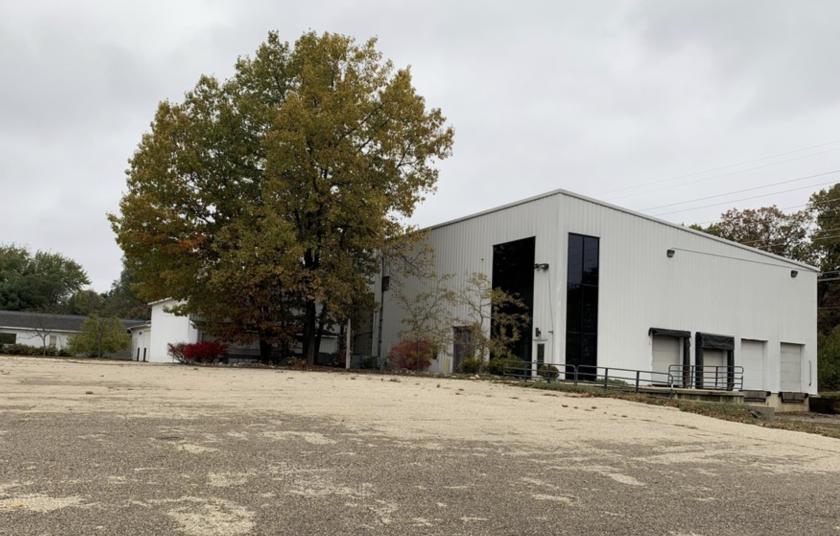
- • Two access points from different streets
- • 4 docks and 3 overhead doors
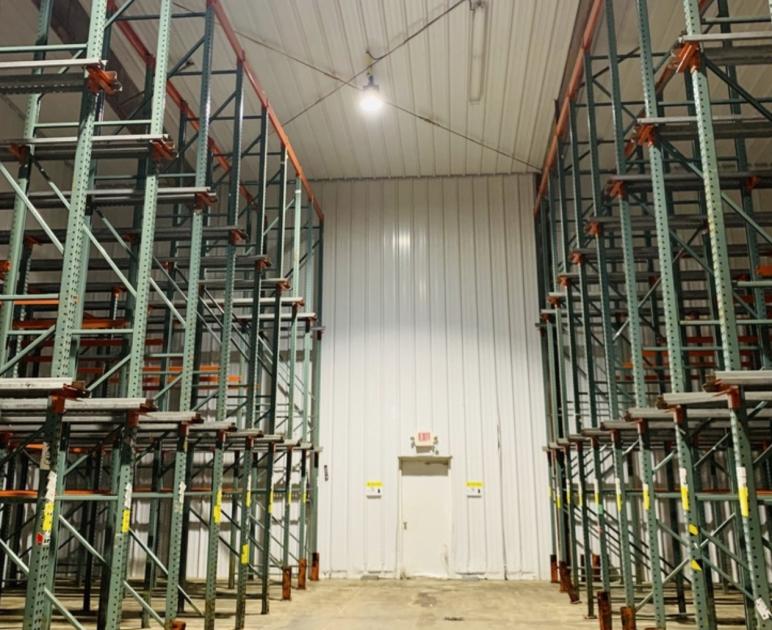
- • 34 to 24 clear-sloped ceilings
- • Room for expansion
Listing Agents

Drew Nelson
M: 616-975-3739
dnelson@bradleyco.com
M: 616-975-3739
dnelson@bradleyco.com

Vee Kimbrell
Bradley Company
O: 574-213-5585
vkimbrell@bradleyco.com
Bradley Company
O: 574-213-5585
vkimbrell@bradleyco.com
While we strive to provide the most accurate information, all listing information, and demographic data, is provided by third-parties. As such, MyEListing will not be responsible for the accuracy of the information. It is strongly recommended that you verify all information with the listing agent, and any relevant agencies, prior to making any decisions.