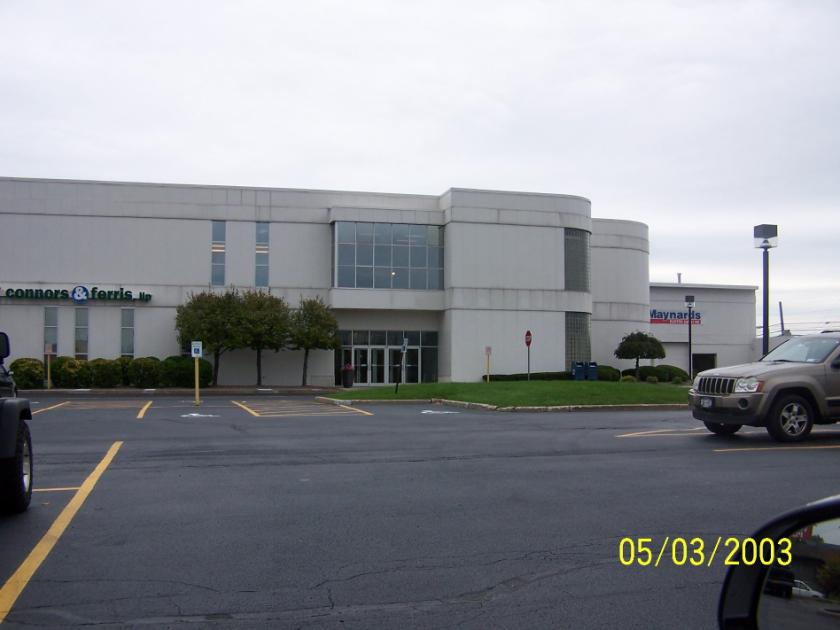
1-Mile | 3-Miles | 5-Miles | ||
---|---|---|---|---|
Total Population | 5,569 | 56,241 | 192,865 | |
Population Median Age | 40 | 40 | 38 | |
Population by Age | 0-9 Yrs | 417 (7%) | 5121 (9%) | 17462 (9%) |
10-19 Yrs | 866 (15%) | 7828 (13%) | 25983 (13%) | |
20-29 Yrs | 998 (17%) | 9289 (16%) | 38981 (20%) | |
30-39 Yrs | 689 (12%) | 6818 (12%) | 25681 (13%) | |
40-49 Yrs | 591 (10%) | 6455 (11%) | 20575 (10%) | |
50-59 Yrs | 598 (10%) | 6203 (11%) | 23004 (11%) | |
60-69 Yrs | 703 (12%) | 6368 (11%) | 20019 (10%) | |
70+ Yrs | 707 (12%) | 8158 (14%) | 21159 (10%) | |
Median HH Income | $62,917 | $69,883 | $55,915 | |
Total Household Income | < 24K | 306 (12%) | 3760 (16%) | 19380 (23%) |
25-49K | 595 (25%) | 4499 (19%) | 17395 (21%) | |
50-74K | 479 (20%) | 3739 (16%) | 13604 (16%) | |
75-99K | 290 (12%) | 2745 (12%) | 9115 (11%) | |
100-199K | 541 (22%) | 5502 (24%) | 15514 (19%) | |
200K+ | 155 (6%) | 2445 (10%) | 6052 (7%) | |
Highest Education Level | No Diploma | 316 | 2372 | 12421 |
Diploma or GED | 533 | 5392 | 22715 | |
Some College | 604 | 4957 | 19752 | |
Assoc. Degree | 285 | 2775 | 11370 | |
Bachelors Degree | 1014 | 10702 | 31317 | |
Higher Degree | 1119 | 12569 | 32149 | |
Total Housing Units | 2,460 | 24,199 | 89,712 | |
--Owner-Occupied | 1,219 | 13,757 | 40,029 | |
--Renter-Occupied | 1,147 | 8,933 | 41,031 | |
Owner-Occupied Values | < 100K | 146 | 752 | 7568 |
100-199K | 766 | 7154 | 17734 | |
200-299K | 232 | 3142 | 7960 | |
300-399K | 50 | 1406 | 3432 | |
400-499K | 18 | 726 | 1478 | |
500K+ | 7 | 578 | 1858 | |
Total Working Age Population | 4,728 | 47,031 | 162,819 | |
In Work Force | 3,032 | 28,854 | 103,117 | |
Not In Work Force | 1,696 | 18,177 | 59,701 | |
Workforce Employed | 2,831 | 27,415 | 96,840 | |
Workforce Unemployed | 185 | 1,399 | 6,211 | |
Civlian Workforce | 3,016 | 28,814 | 103,051 | |
Military Workforce | 15 | 40 | 66 | |
Total Households | 2,367 | 22,690 | 81,060 | |
Family Households | 1,163 | 12,624 | 39,601 | |
Non-Family Households | 1,203 | 10,066 | 41,459 | |
Married Couple | 825 | 9,981 | 26,872 | |
Other Family | 338 | 2,643 | 12,728 | |
Married w/Child | 290 | 4,010 | 9,626 | |
Single Male w/Child | 13 | 266 | 1,292 | |
Single Female w/Child | 130 | 1,070 | 5,821 |
Population Change Last Two Decades - Plus Projection
2000 | % | 2010 | % | 2020 | % | 2030 | |
---|---|---|---|---|---|---|---|
New York | 18,976,457 | +2 | 19,378,102 | +4 | 20,146,131 | +2 | 20,604,030 |
Monroe County | 735,343 | +1 | 744,344 | +1 | 754,529 | +1 | 758,536 |
Ontario County | 100,224 | +8 | 107,931 | +3 | 111,349 | +3 | 114,374 |
Total Working Age Population:
Total Households:
Total Working Age Population:
Total Households:
Total Working Age Population:
Total Households: