Retail Space
1 Medley Centre Parkway Irondequoit, NY 14609
1 Medley Centre Parkway Irondequoit, NY 14609
Details & Description
Property Highlights
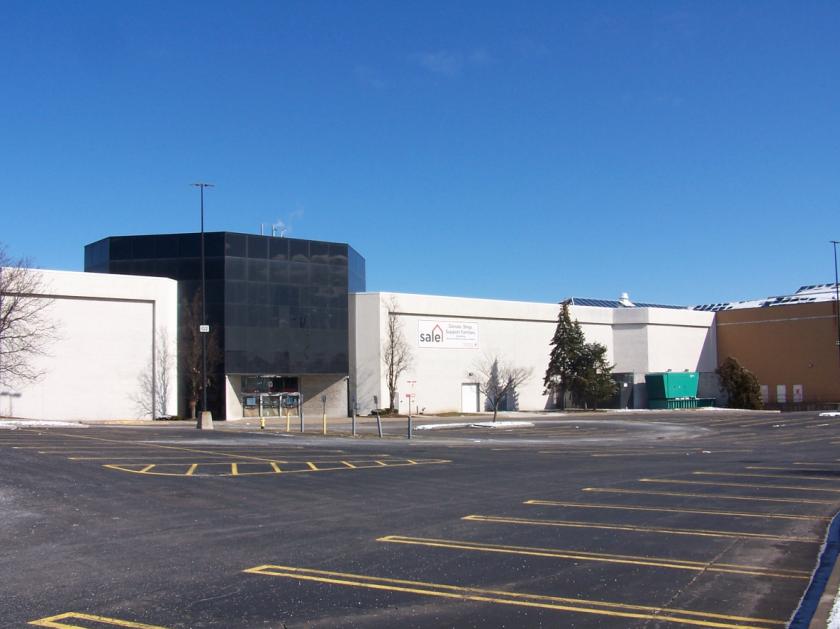
- • Great visibility
- • Lots of parking
- • Wide open space
Listing Agents

Michael Palumbo
O: 585-546-4866
mpalumbo@flaummgt.com
O: 585-546-4866
mpalumbo@flaummgt.com
While we strive to provide the most accurate information, all listing information, and demographic data, is provided by third-parties. As such, MyEListing will not be responsible for the accuracy of the information. It is strongly recommended that you verify all information with the listing agent, and any relevant agencies, prior to making any decisions.


