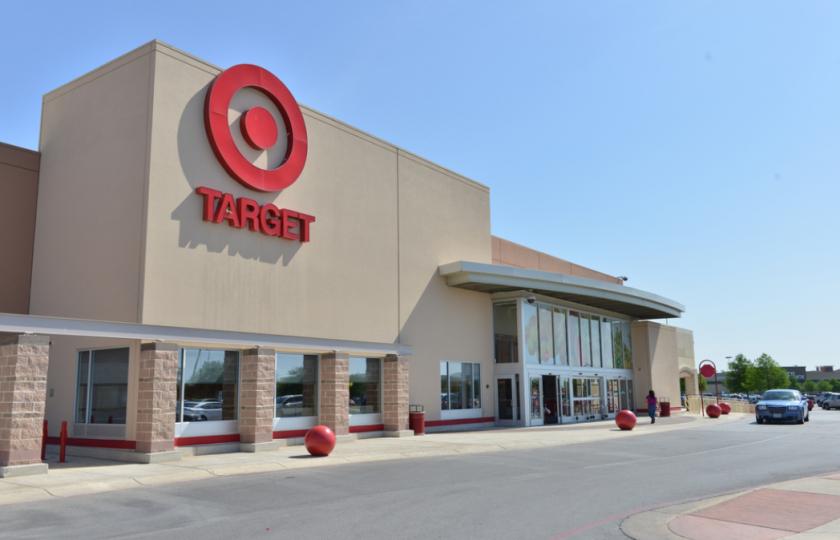
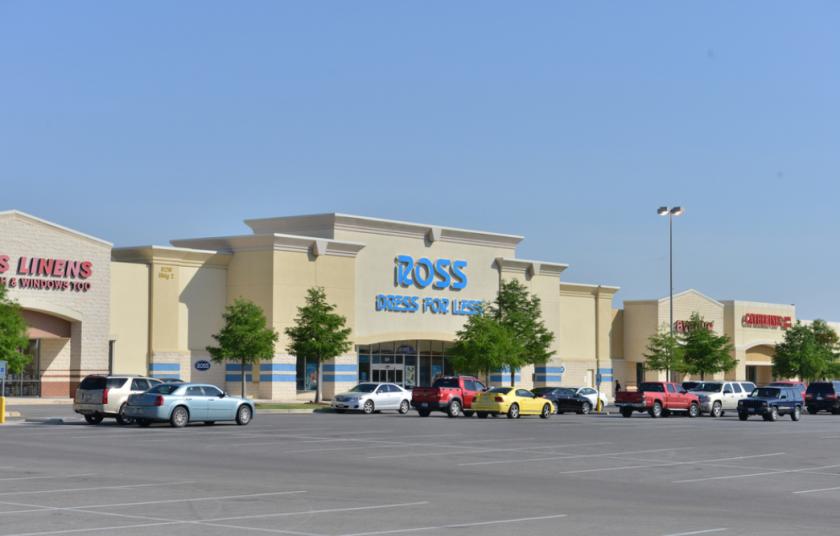
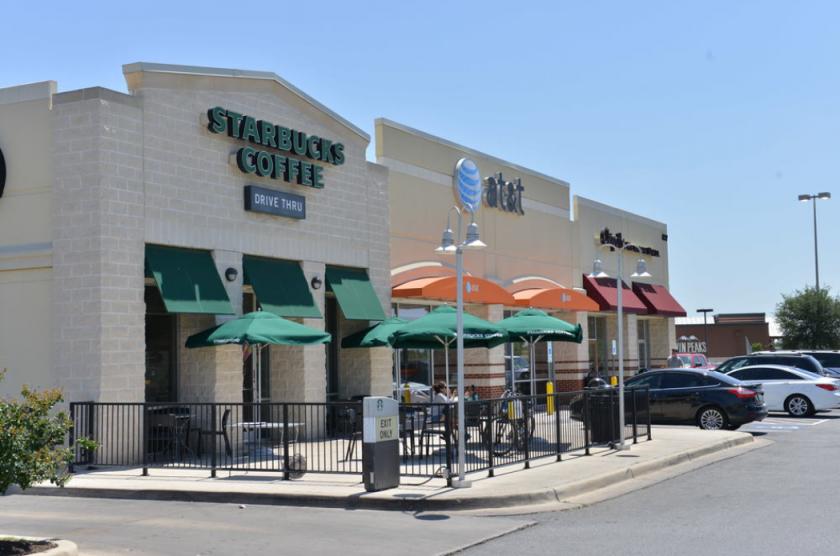
1-Mile | 3-Miles | 5-Miles | ||
---|---|---|---|---|
Total Population | 10,894 | 130,149 | 306,307 | |
Population Median Age | 31 | 34 | 34 | |
Population by Age | 0-9 Yrs | 1686 (15%) | 19368 (14%) | 45990 (15%) |
10-19 Yrs | 1520 (13%) | 19533 (15%) | 48383 (15%) | |
20-29 Yrs | 2503 (22%) | 22011 (16%) | 49367 (16%) | |
30-39 Yrs | 1789 (16%) | 20164 (15%) | 46172 (15%) | |
40-49 Yrs | 1306 (11%) | 16816 (12%) | 38247 (12%) | |
50-59 Yrs | 920 (8%) | 13812 (10%) | 33527 (10%) | |
60-69 Yrs | 692 (6%) | 10581 (8%) | 24982 (8%) | |
70+ Yrs | 477 (4%) | 7863 (6%) | 19637 (6%) | |
Median HH Income | $45,088 | $53,472 | $56,037 | |
Total Household Income | < 24K | 965 (23%) | 7903 (19%) | 18030 (19%) |
25-49K | 1238 (30%) | 11316 (27%) | 22920 (24%) | |
50-74K | 878 (21%) | 8833 (21%) | 19605 (21%) | |
75-99K | 426 (10%) | 5164 (12%) | 12865 (13%) | |
100-199K | 505 (12%) | 7028 (17%) | 16612 (18%) | |
200K+ | 21 (0%) | 829 (2%) | 2077 (2%) | |
Highest Education Level | No Diploma | 939 | 13688 | 33039 |
Diploma or GED | 2151 | 23308 | 53248 | |
Some College | 1886 | 20570 | 46244 | |
Assoc. Degree | 525 | 7862 | 18410 | |
Bachelors Degree | 861 | 10374 | 25844 | |
Higher Degree | 559 | 5273 | 11686 | |
Total Housing Units | 4,474 | 43,939 | 98,037 | |
--Owner-Occupied | 1,593 | 22,047 | 55,760 | |
--Renter-Occupied | 2,441 | 19,027 | 36,348 | |
Owner-Occupied Values | < 100K | 243 | 6006 | 15935 |
100-199K | 974 | 12704 | 30599 | |
200-299K | 354 | 2763 | 7848 | |
300-399K | 20 | 467 | 993 | |
400-499K | 2 | 55 | 163 | |
500K+ | 0 | 52 | 224 | |
Total Working Age Population | 8,366 | 99,321 | 232,609 | |
In Work Force | 6,247 | 67,776 | 155,417 | |
Not In Work Force | 2,119 | 31,546 | 77,192 | |
Workforce Employed | 5,518 | 61,749 | 139,141 | |
Workforce Unemployed | 459 | 4,689 | 9,520 | |
Civlian Workforce | 5,977 | 66,438 | 148,661 | |
Military Workforce | 270 | 1,337 | 6,756 | |
Total Households | 4,034 | 41,073 | 92,108 | |
Family Households | 2,195 | 27,739 | 65,913 | |
Non-Family Households | 1,839 | 13,335 | 26,196 | |
Married Couple | 1,285 | 18,010 | 43,021 | |
Other Family | 910 | 9,729 | 22,892 | |
Married w/Child | 745 | 9,050 | 20,695 | |
Single Male w/Child | 37 | 909 | 2,439 | |
Single Female w/Child | 384 | 4,035 | 9,584 |
Population Change Last Two Decades - Plus Projection
2000 | % | 2010 | % | 2020 | % | 2030 | |
---|---|---|---|---|---|---|---|
Texas | 20,851,820 | +21 | 25,145,561 | +18 | 29,677,668 | +18 | 34,894,452 |
Bexar County | 1,392,931 | +23 | 1,714,773 | +22 | 2,093,502 | +20 | 2,502,617 |
Total Working Age Population:
Total Households:
Total Working Age Population:
Total Households:
Total Working Age Population:
Total Households: