Retail Space
403 North Loop 1604 West San Antonio, TX 78258
403 North Loop 1604 West San Antonio, TX 78258

Details & Description
Property Highlights
• Built in 2014, Sonterra Village is well-placed to take advantage of San Antonios burgeoning growth
• Sonterra Village is convenient to the 4,200 acre Stone Oak master planned community
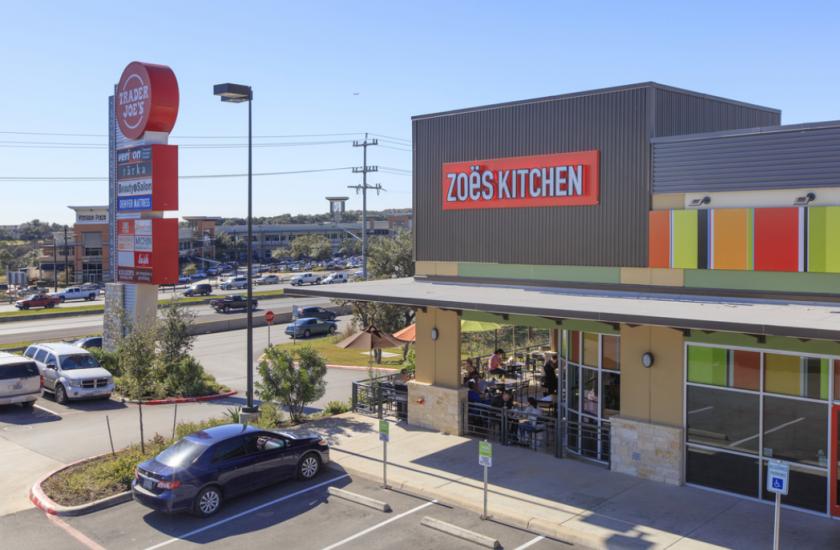
Additional Photos


Listing Agents

Joe DeCola
O: 830-739-4646
joe.decola@naipartners.com
O: 830-739-4646
joe.decola@naipartners.com
While we strive to provide the most accurate information, all listing information, and demographic data, is provided by third-parties. As such, MyEListing will not be responsible for the accuracy of the information. It is strongly recommended that you verify all information with the listing agent, and any relevant agencies, prior to making any decisions.


