Office Space
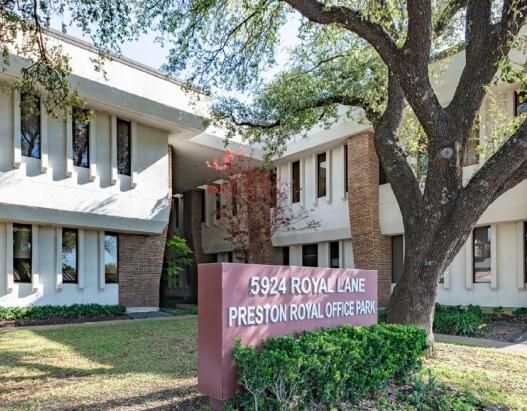
5924 Royal Lane, 130 154 260 270 Dallas, TX 75230
5924 Royal Lane, 130 154 260 270 Dallas, TX 75230
Details & Description
Property Highlights
- • Conference Room
- • Tenant Lounge
- • Adjacent Daycare Services
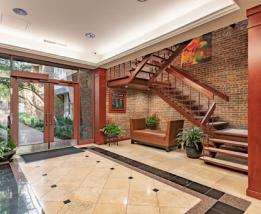
Additional Photos

Listing Agents

Ben Cuzen
O: 972-850-2714
bcuzen@hpitx.com
O: 972-850-2714
bcuzen@hpitx.com

Hunter Lee
O: 214-954-3304
hlee@hpitx.com
O: 214-954-3304
hlee@hpitx.com
While we strive to provide the most accurate information, all listing information, and demographic data, is provided by third-parties. As such, MyEListing will not be responsible for the accuracy of the information. It is strongly recommended that you verify all information with the listing agent, and any relevant agencies, prior to making any decisions.


