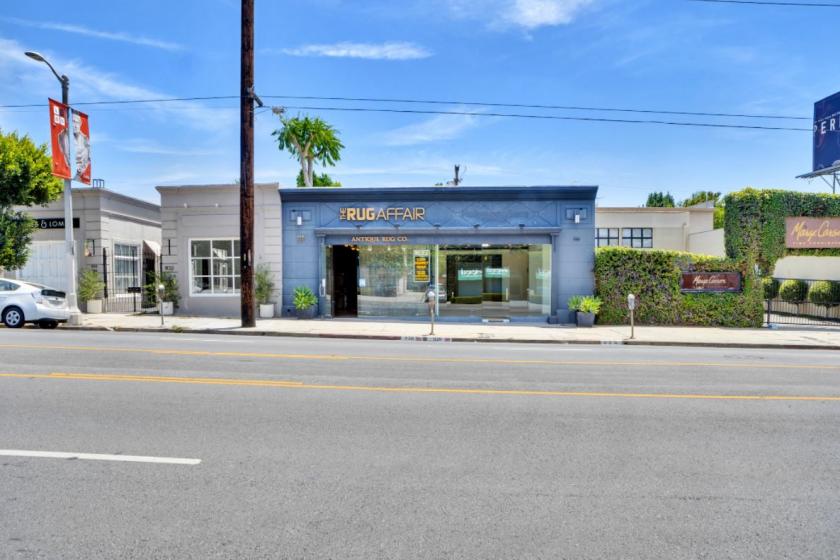
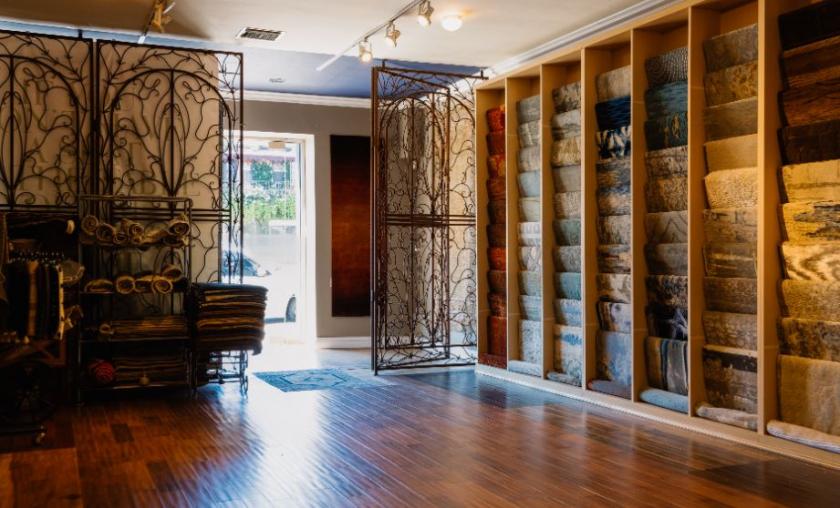
1-Mile | 3-Miles | 5-Miles | ||
---|---|---|---|---|
Total Population | 40,922 | 246,324 | 781,640 | |
Population Median Age | 42 | 41 | 39 | |
Population by Age | 0-9 Yrs | 1613 (3%) | 18064 (7%) | 67889 (8%) |
10-19 Yrs | 879 (2%) | 16165 (6%) | 70173 (8%) | |
20-29 Yrs | 8128 (19%) | 44828 (18%) | 149035 (19%) | |
30-39 Yrs | 10714 (26%) | 51279 (20%) | 143923 (18%) | |
40-49 Yrs | 6167 (15%) | 37385 (15%) | 111240 (14%) | |
50-59 Yrs | 5404 (13%) | 29727 (12%) | 92809 (11%) | |
60-69 Yrs | 3971 (9%) | 23010 (9%) | 73762 (9%) | |
70+ Yrs | 4046 (9%) | 25866 (10%) | 72808 (9%) | |
Median HH Income | $88,484 | $82,244 | $67,929 | |
Total Household Income | < 24K | 3766 (15%) | 22284 (17%) | 69944 (20%) |
25-49K | 3439 (14%) | 17864 (14%) | 63998 (18%) | |
50-74K | 3360 (13%) | 18646 (14%) | 52165 (15%) | |
75-99K | 3043 (12%) | 14751 (11%) | 38330 (11%) | |
100-199K | 6662 (27%) | 30810 (24%) | 72493 (21%) | |
200K+ | 4143 (16%) | 21783 (17%) | 46807 (13%) | |
Highest Education Level | No Diploma | 809 | 8959 | 71245 |
Diploma or GED | 3796 | 21323 | 83203 | |
Some College | 6135 | 31960 | 94306 | |
Assoc. Degree | 1980 | 11267 | 32470 | |
Bachelors Degree | 16400 | 79388 | 192632 | |
Higher Degree | 7656 | 44690 | 108665 | |
Total Housing Units | 27,297 | 144,595 | 388,242 | |
--Owner-Occupied | 6,639 | 35,028 | 93,151 | |
--Renter-Occupied | 17,774 | 91,112 | 250,586 | |
Owner-Occupied Values | < 100K | 57 | 451 | 1413 |
100-199K | 39 | 240 | 789 | |
200-299K | 83 | 329 | 1564 | |
300-399K | 194 | 1000 | 3132 | |
400-499K | 495 | 1342 | 4540 | |
500K+ | 5771 | 31665 | 81713 | |
Total Working Age Population | 38,693 | 217,906 | 676,695 | |
In Work Force | 30,601 | 161,007 | 473,087 | |
Not In Work Force | 8,093 | 56,899 | 203,608 | |
Workforce Employed | 29,084 | 151,273 | 445,071 | |
Workforce Unemployed | 1,472 | 9,518 | 27,754 | |
Civlian Workforce | 30,556 | 160,791 | 472,825 | |
Military Workforce | 45 | 216 | 263 | |
Total Households | 24,412 | 126,139 | 343,737 | |
Family Households | 6,308 | 46,258 | 152,739 | |
Non-Family Households | 18,104 | 79,881 | 190,998 | |
Married Couple | 5,062 | 36,230 | 108,097 | |
Other Family | 1,246 | 10,028 | 44,642 | |
Married w/Child | 1,072 | 12,686 | 41,135 | |
Single Male w/Child | 68 | 1,356 | 4,853 | |
Single Female w/Child | 308 | 2,468 | 12,359 |
Population Change Last Two Decades - Plus Projection
2000 | % | 2010 | % | 2020 | % | 2030 | |
---|---|---|---|---|---|---|---|
California | 33,871,648 | +10 | 37,253,956 | +9 | 40,467,295 | +8 | 43,631,295 |
Los Angeles County | 9,519,338 | +3 | 9,818,605 | +6 | 10,369,367 | +4 | 10,759,850 |
Total Working Age Population:
Total Households:
Total Working Age Population:
Total Households:
Total Working Age Population:
Total Households: