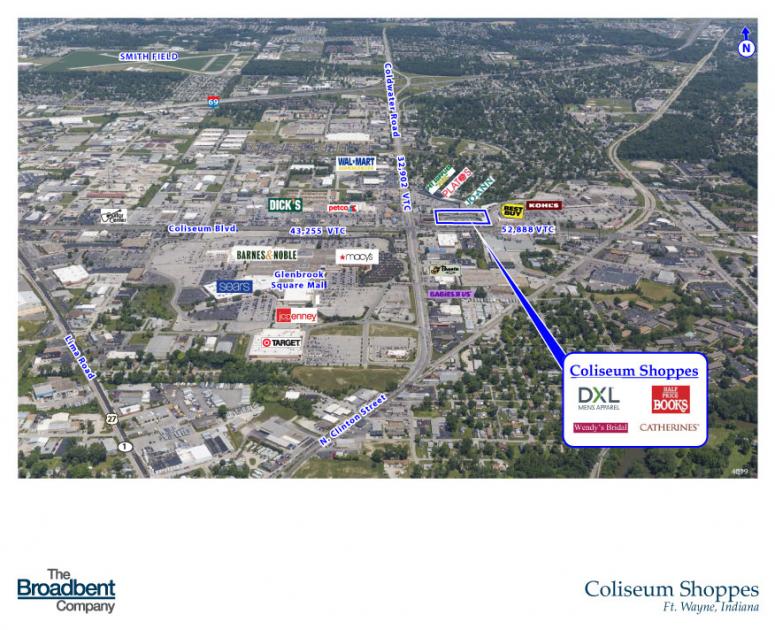
1-Mile | 3-Miles | 5-Miles | ||
---|---|---|---|---|
Total Population | 6,550 | 76,173 | 173,359 | |
Population Median Age | 36 | 37 | 36 | |
Population by Age | 0-9 Yrs | 855 (13%) | 10005 (13%) | 24462 (14%) |
10-19 Yrs | 719 (10%) | 8892 (11%) | 23117 (13%) | |
20-29 Yrs | 1306 (19%) | 15198 (19%) | 28762 (16%) | |
30-39 Yrs | 1231 (18%) | 10254 (13%) | 23451 (13%) | |
40-49 Yrs | 650 (9%) | 8343 (10%) | 20266 (11%) | |
50-59 Yrs | 724 (11%) | 8572 (11%) | 19987 (11%) | |
60-69 Yrs | 584 (8%) | 8127 (10%) | 17956 (10%) | |
70+ Yrs | 482 (7%) | 6782 (8%) | 15359 (8%) | |
Median HH Income | $41,820 | $44,781 | $47,396 | |
Total Household Income | < 24K | 795 (29%) | 8225 (25%) | 16802 (24%) |
25-49K | 757 (28%) | 9564 (29%) | 19898 (28%) | |
50-74K | 585 (21%) | 6694 (20%) | 13854 (19%) | |
75-99K | 368 (13%) | 3574 (11%) | 8601 (12%) | |
100-199K | 167 (6%) | 3450 (10%) | 9243 (13%) | |
200K+ | 24 (0%) | 571 (1%) | 1367 (1%) | |
Highest Education Level | No Diploma | 729 | 5747 | 13164 |
Diploma or GED | 1301 | 14927 | 32420 | |
Some College | 926 | 11215 | 25530 | |
Assoc. Degree | 465 | 5019 | 11709 | |
Bachelors Degree | 626 | 8722 | 19204 | |
Higher Degree | 205 | 3930 | 9407 | |
Total Housing Units | 2,967 | 35,170 | 77,267 | |
--Owner-Occupied | 1,006 | 17,134 | 41,817 | |
--Renter-Occupied | 1,690 | 14,943 | 27,949 | |
Owner-Occupied Values | < 100K | 522 | 9150 | 18675 |
100-199K | 473 | 6954 | 18898 | |
200-299K | 10 | 610 | 2729 | |
300-399K | 0 | 185 | 912 | |
400-499K | 0 | 54 | 241 | |
500K+ | 1 | 182 | 363 | |
Total Working Age Population | 5,278 | 61,078 | 134,865 | |
In Work Force | 3,721 | 40,861 | 90,296 | |
Not In Work Force | 1,557 | 20,216 | 44,569 | |
Workforce Employed | 3,523 | 39,217 | 85,480 | |
Workforce Unemployed | 198 | 1,620 | 4,766 | |
Civlian Workforce | 3,721 | 40,837 | 90,246 | |
Military Workforce | 0 | 25 | 50 | |
Total Households | 2,696 | 32,077 | 69,766 | |
Family Households | 1,447 | 16,868 | 40,727 | |
Non-Family Households | 1,250 | 15,209 | 29,039 | |
Married Couple | 901 | 11,128 | 27,012 | |
Other Family | 546 | 5,740 | 13,715 | |
Married w/Child | 349 | 4,376 | 10,808 | |
Single Male w/Child | 190 | 1,077 | 2,189 | |
Single Female w/Child | 214 | 2,244 | 6,034 |
Population Change Last Two Decades - Plus Projection
2000 | % | 2010 | % | 2020 | % | 2030 | |
---|---|---|---|---|---|---|---|
Indiana | 6,080,485 | +7 | 6,483,802 | +4 | 6,738,573 | +4 | 7,014,880 |
Allen County | 331,849 | +7 | 355,329 | +7 | 379,671 | +6 | 402,948 |
Total Working Age Population:
Total Households:
Total Working Age Population:
Total Households:
Total Working Age Population:
Total Households: